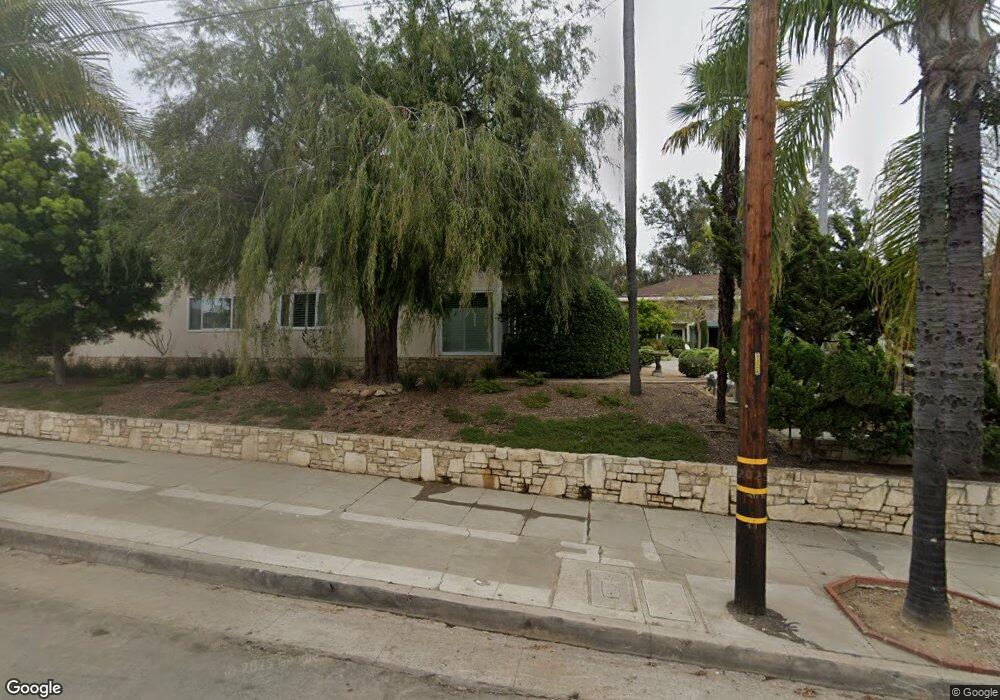
2030 State #2 St Unit 2 Santa Barbara, CA 93105
Oak Park NeighborhoodEstimated Value: $808,000 - $1,077,000
2
Beds
2
Baths
1,346
Sq Ft
$737/Sq Ft
Est. Value
About This Home
This home is located at 2030 State #2 St Unit 2, Santa Barbara, CA 93105 and is currently estimated at $991,968, approximately $736 per square foot. 2030 State #2 St Unit 2 is a home located in Santa Barbara County with nearby schools including Roosevelt Elementary School, Santa Barbara Junior High School, and Santa Barbara Senior High School.
Ownership History
Date
Name
Owned For
Owner Type
Purchase Details
Closed on
Aug 12, 1999
Sold by
Selker Adrienne
Bought by
King Jonatha
Current Estimated Value
Home Financials for this Owner
Home Financials are based on the most recent Mortgage that was taken out on this home.
Original Mortgage
$172,000
Outstanding Balance
$48,346
Interest Rate
7.37%
Mortgage Type
Purchase Money Mortgage
Estimated Equity
$943,622
Purchase Details
Closed on
Jun 9, 1999
Sold by
Irwin Frieda Revocable Trust and Adrienne
Bought by
Selker Adrienne
Purchase Details
Closed on
Mar 10, 1998
Sold by
Irwin Frieda
Bought by
Frieda Irwin Revocable Living Trust
Purchase Details
Closed on
Jul 8, 1996
Sold by
Philip Ronald E and Philip Suzy A
Bought by
Irwin Frieda
Home Financials for this Owner
Home Financials are based on the most recent Mortgage that was taken out on this home.
Original Mortgage
$70,000
Interest Rate
8.32%
Mortgage Type
Purchase Money Mortgage
Create a Home Valuation Report for This Property
The Home Valuation Report is an in-depth analysis detailing your home's value as well as a comparison with similar homes in the area
Home Values in the Area
Average Home Value in this Area
Purchase History
| Date | Buyer | Sale Price | Title Company |
|---|---|---|---|
| King Jonatha | $282,000 | Chicago Title Co | |
| Selker Adrienne | -- | -- | |
| Frieda Irwin Revocable Living Trust | -- | -- | |
| Irwin Frieda | $137,500 | Santa Barbara Title Co |
Source: Public Records
Mortgage History
| Date | Status | Borrower | Loan Amount |
|---|---|---|---|
| Open | King Jonatha | $172,000 | |
| Previous Owner | Irwin Frieda | $70,000 |
Source: Public Records
Tax History
| Year | Tax Paid | Tax Assessment Tax Assessment Total Assessment is a certain percentage of the fair market value that is determined by local assessors to be the total taxable value of land and additions on the property. | Land | Improvement |
|---|---|---|---|---|
| 2025 | $4,536 | $433,406 | $216,703 | $216,703 |
| 2023 | $4,536 | $416,578 | $208,289 | $208,289 |
| 2022 | $4,376 | $408,410 | $204,205 | $204,205 |
| 2021 | $4,274 | $400,402 | $200,201 | $200,201 |
| 2020 | $4,230 | $396,298 | $198,149 | $198,149 |
| 2019 | $4,156 | $388,528 | $194,264 | $194,264 |
| 2018 | $4,097 | $380,910 | $190,455 | $190,455 |
| 2017 | $3,962 | $373,442 | $186,721 | $186,721 |
| 2016 | $3,939 | $366,120 | $183,060 | $183,060 |
| 2015 | $3,896 | $360,622 | $180,311 | $180,311 |
| 2014 | $3,834 | $353,558 | $176,779 | $176,779 |
Source: Public Records
Map
Nearby Homes
- 15 W Padre St
- 111 E Pedregosa St
- 115 W Junipero St
- 2019 Bath St
- 9 E Quinto St
- 1917 Bath St
- 233 W Quinto St
- 1701 Anacapa St Unit 20
- 2510 Orella St
- 2019 Castillo St
- 2535 De la Vina St
- 2203 Parkway Dr
- 1617 Chapala St Unit A, B, C, D
- 1621 Chapala St Unit A, B, C, D
- 2117 Oak Park Ln
- 411 E Islay St
- 1600 Santa Barbara St
- 2430 Fletcher Ave
- 513 E Pedregosa St
- 2767 Miradero Dr Unit C
- 2030 State #3 St Unit 3
- 2030 State #6 St
- 2030 State St Unit 19
- 2036 State St
- 2005 State St
- 2030 State St Unit One
- 2030 State St Unit 2030 State St.22
- 2030 State St
- 2030 State St
- 2030 State St Unit 25
- 2030 State St Unit 24
- 2030 State St Unit 23
- 2030 State St Unit 22
- 2030 State St Unit 21
- 2030 State St Unit 20
- 2030 State St Unit 2
- 2030 State St Unit 1
- 2030 State St Unit 19
- 2030 State St Unit 18
- 2030 State St Unit 17
Your Personal Tour Guide
Ask me questions while you tour the home.