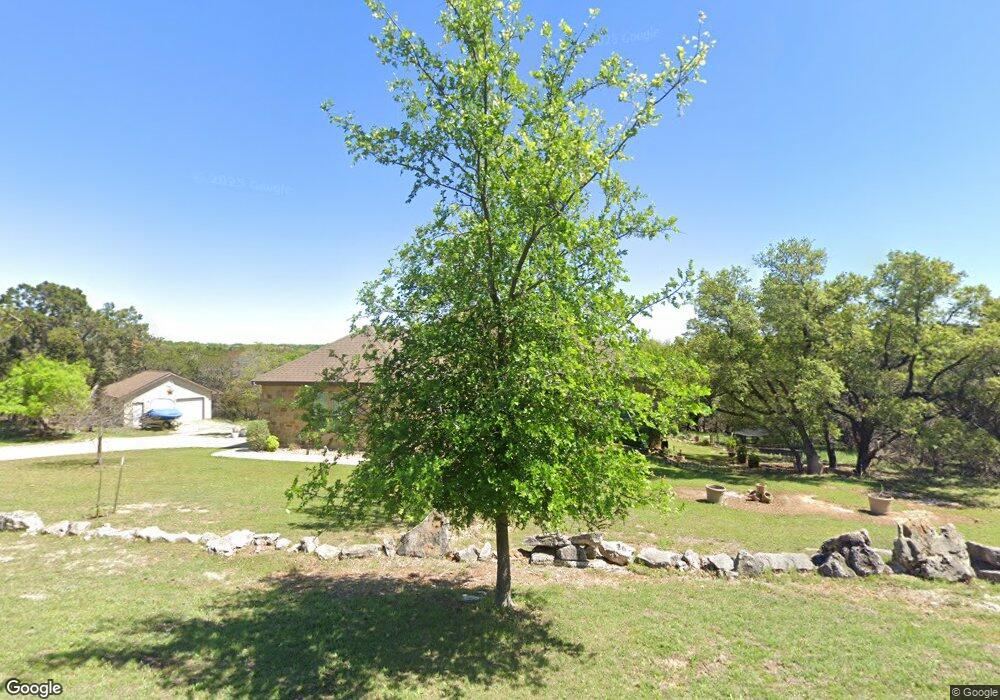
20309 Hunters Point Dr Georgetown, TX 78633
Estimated Value: $770,000 - $900,000
--
Bed
1
Bath
2,753
Sq Ft
$305/Sq Ft
Est. Value
About This Home
This home is located at 20309 Hunters Point Dr, Georgetown, TX 78633 and is currently estimated at $840,418, approximately $305 per square foot. 20309 Hunters Point Dr is a home with nearby schools including Jo Ann Ford Elementary School, Douglas Benold Middle School, and Georgetown High School.
Ownership History
Date
Name
Owned For
Owner Type
Purchase Details
Closed on
Oct 1, 2025
Sold by
Nguyen Phuong-Lan Tran and Nguyen Phuong Lan
Bought by
Truc And Phuonglan Nguyen Revocable Trust and Nguyen
Current Estimated Value
Purchase Details
Closed on
Jun 6, 2017
Sold by
Richmond Kenneth
Bought by
Richmond Properties Inc
Purchase Details
Closed on
Jul 22, 2015
Sold by
Wilde Wood Construction & Development Gr
Bought by
Nguyen Truc M and Nguyen Phuong Lan T
Purchase Details
Closed on
Jul 15, 2015
Sold by
Self Directed Ira Services Inc
Bought by
Wilde Wood Construction & Development Gr
Purchase Details
Closed on
Jun 18, 2014
Sold by
Hart Bobby Don and Ann M Hart D
Bought by
Self Directed Ira Services Inc and J Michael Willoughby Ira
Create a Home Valuation Report for This Property
The Home Valuation Report is an in-depth analysis detailing your home's value as well as a comparison with similar homes in the area
Home Values in the Area
Average Home Value in this Area
Purchase History
| Date | Buyer | Sale Price | Title Company |
|---|---|---|---|
| Truc And Phuonglan Nguyen Revocable Trust | -- | None Listed On Document | |
| Truc And Phuonglan Nguyen Revocable Trust | -- | None Listed On Document | |
| Richmond Properties Inc | -- | Longhorn Title Co Inc | |
| Nguyen Truc M | -- | Georgetown Title Company Inc | |
| Wilde Wood Construction & Development Gr | -- | Georgetown Title Company Inc | |
| Self Directed Ira Services Inc | -- | Georgetown Title Company Inc |
Source: Public Records
Tax History Compared to Growth
Tax History
| Year | Tax Paid | Tax Assessment Tax Assessment Total Assessment is a certain percentage of the fair market value that is determined by local assessors to be the total taxable value of land and additions on the property. | Land | Improvement |
|---|---|---|---|---|
| 2025 | $10,520 | $830,363 | -- | -- |
| 2024 | $10,520 | $754,875 | -- | -- |
| 2023 | $9,256 | $686,250 | $0 | $0 |
| 2022 | $10,500 | $623,864 | $0 | $0 |
| 2021 | $10,582 | $567,149 | $139,370 | $467,631 |
| 2020 | $9,784 | $515,590 | $101,351 | $429,333 |
| 2019 | $9,225 | $468,718 | $94,726 | $406,496 |
| 2018 | $8,032 | $426,107 | $71,045 | $355,062 |
| 2017 | $9,019 | $455,598 | $60,095 | $395,503 |
| 2016 | $8,318 | $420,194 | $46,955 | $373,239 |
| 2015 | $785 | $43,670 | $43,670 | $0 |
| 2014 | $785 | $39,644 | $0 | $0 |
Source: Public Records
Map
Nearby Homes
- 209 Goldridge Dr
- 122 Silverstone
- 1301 County Road 262
- 705 Highland Overlook
- 127 Roberts Cir
- 307 Highland Spring Ln
- 100 Portafino Ln
- 111 Roberts Cir
- 524 Highland Spring Ln
- 4004 Fountainwood Cir
- 511 County Road 262
- 109 Willow Hill Dr
- 224 Whitney Woods Cir
- 110 Starlight Trail
- 405 Allen Cir
- 210 Buoy Cir
- 410 Shady Tree Dr
- 305 Shady Tree Dr
- 419 Allen Cir
- 707 Harbor Dr
- 20313 Hunters Point Dr
- 20305 Hunters Point Dr
- 20304 Hunters Point Dr
- 20310 Hunters Point Dr
- 20315 Hunters Point Dr
- 20314 Hunters Point Dr
- 20300 Hunters Point Dr
- 20301 Hunters Point Dr
- 20321 Hunters Point Dr Unit 2
- 20321 Hunters Point Dr
- 20208 Deer Field Dr
- 20324 Hunters Point Dr
- 20204 Deer Field Dr
- 20102 Turkey Trot Cir
- 20100 Turkey Trot Cir
- 20200 Hunters Point Dr
- 20104 Turkey Trot Cir
- 20217 Deer Field Dr
- 0 Hunters Point Unit 4777476
- 0 Hunters Point Dr Unit 6510477