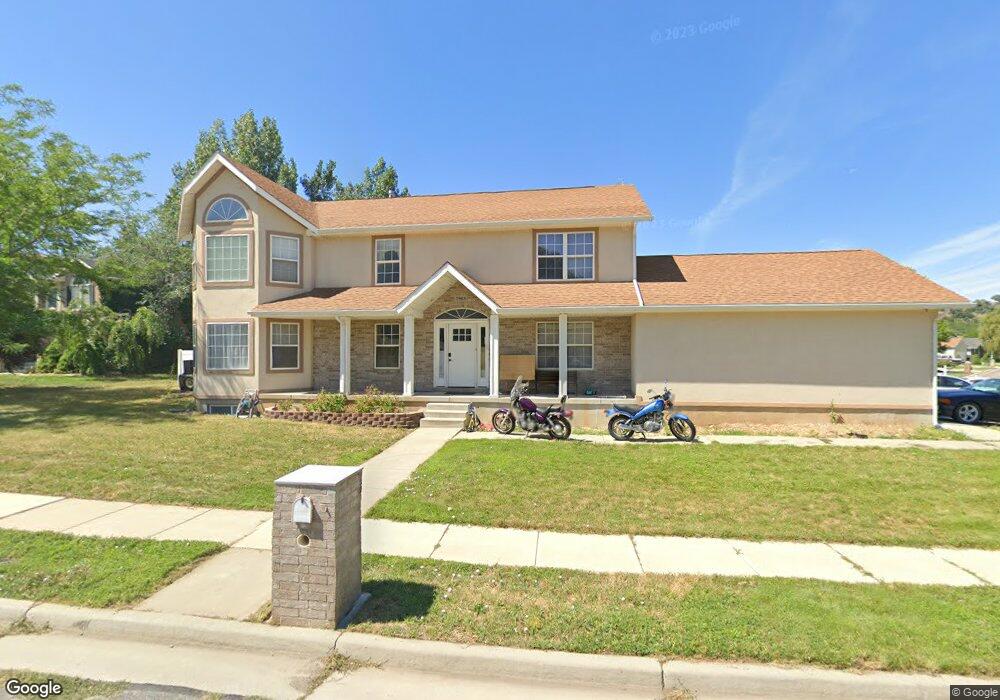
2031 Cedar Loop Dr South Weber, UT 84405
Estimated Value: $644,000 - $748,836
--
Bed
3
Baths
2,890
Sq Ft
$246/Sq Ft
Est. Value
About This Home
This home is located at 2031 Cedar Loop Dr, South Weber, UT 84405 and is currently estimated at $709,709, approximately $245 per square foot. 2031 Cedar Loop Dr is a home located in Davis County with nearby schools including South Weber Elementary School, Sunset Junior High School, and Northridge High School.
Ownership History
Date
Name
Owned For
Owner Type
Purchase Details
Closed on
Oct 28, 2020
Sold by
Cooper Terone and Cooper Tonya
Bought by
Cooper Terone and Cooper Tonya Lynne
Current Estimated Value
Home Financials for this Owner
Home Financials are based on the most recent Mortgage that was taken out on this home.
Original Mortgage
$350,400
Outstanding Balance
$248,561
Interest Rate
2.3%
Mortgage Type
New Conventional
Estimated Equity
$461,148
Purchase Details
Closed on
Oct 14, 1998
Sold by
Nilson & Company Inc
Bought by
Cooper Terone and Cooper Tonya
Home Financials for this Owner
Home Financials are based on the most recent Mortgage that was taken out on this home.
Original Mortgage
$183,000
Interest Rate
6.79%
Mortgage Type
Purchase Money Mortgage
Purchase Details
Closed on
Mar 11, 1998
Sold by
U S Development Inc
Bought by
Nilson & Company Inc and Nilson Homes
Home Financials for this Owner
Home Financials are based on the most recent Mortgage that was taken out on this home.
Original Mortgage
$33,960
Interest Rate
7%
Mortgage Type
Purchase Money Mortgage
Create a Home Valuation Report for This Property
The Home Valuation Report is an in-depth analysis detailing your home's value as well as a comparison with similar homes in the area
Purchase History
| Date | Buyer | Sale Price | Title Company |
|---|---|---|---|
| Cooper Terone | -- | First American Titl | |
| Cooper Terone | -- | Bonneville Title Company Inc | |
| Nilson & Company Inc | -- | Bonneville Title Company |
Source: Public Records
Mortgage History
| Date | Status | Borrower | Loan Amount |
|---|---|---|---|
| Open | Cooper Terone | $350,400 | |
| Closed | Cooper Terone | $183,000 | |
| Previous Owner | Nilson & Company Inc | $33,960 |
Source: Public Records
Tax History
| Year | Tax Paid | Tax Assessment Tax Assessment Total Assessment is a certain percentage of the fair market value that is determined by local assessors to be the total taxable value of land and additions on the property. | Land | Improvement |
|---|---|---|---|---|
| 2025 | $4,050 | $365,750 | $116,555 | $249,195 |
| 2024 | $3,756 | $347,050 | $94,524 | $252,526 |
| 2023 | $4,182 | $635,000 | $153,325 | $481,675 |
| 2022 | $3,983 | $377,850 | $74,709 | $303,141 |
| 2021 | $3,559 | $501,000 | $112,130 | $388,870 |
| 2020 | $3,141 | $441,000 | $104,655 | $336,345 |
| 2019 | $3,092 | $419,000 | $101,858 | $317,142 |
| 2018 | $2,797 | $395,000 | $93,920 | $301,080 |
| 2016 | $2,551 | $186,505 | $38,493 | $148,012 |
| 2015 | $2,519 | $174,075 | $38,493 | $135,582 |
| 2014 | $2,492 | $175,151 | $44,245 | $130,906 |
| 2013 | -- | $161,798 | $32,139 | $129,659 |
Source: Public Records
Map
Nearby Homes
- 2204 E View Dr
- 2357 E 8100 S
- 7841 Peachwood Dr
- 1964 E 7550 S
- 7478 1980 E
- 7466 S 1980 E
- 2025 E South Weber Dr
- 2586 Deer Run Dr
- 1873 E 7600 S
- 8036 S 2575 E
- 303 S 2700 E
- 305 S 2700 E Unit 305
- 7212 S Harolds Way
- 7980 S 2800 E
- 3232 N Redtail Way
- 1577 E South Weber Dr Unit 3
- 1365 E Lester Dr
- 1827 E Whitetail Dr
- 1821 E Whitetail Way
- 3176 N 1450 E
- 7903 S 2050 E
- 2023 Cedar Loop Dr
- 7915 S 2050 E
- 7915 S 2050 E Unit 121
- 7896 S 2050 E
- 2017 Cedar Loop Dr
- 7896 Cedar Loop Dr
- 7902 S 2050 E
- 2020 Cedar Loop Dr
- 2017 E Cedar Loop Dr
- 7919 S 2050 E
- 7885 Cedar Loop Dr
- 7885 S Cedar Loop Dr
- 7926 S 2050 E
- 7918 S 2050 E
- 7882 Cedar Loop Dr
- 2005 Cedar Loop Dr
- 2012 Cedar Loop Dr
- 7861 Cedar Loop Dr
- 7909 S 2100 E
Your Personal Tour Guide
Ask me questions while you tour the home.