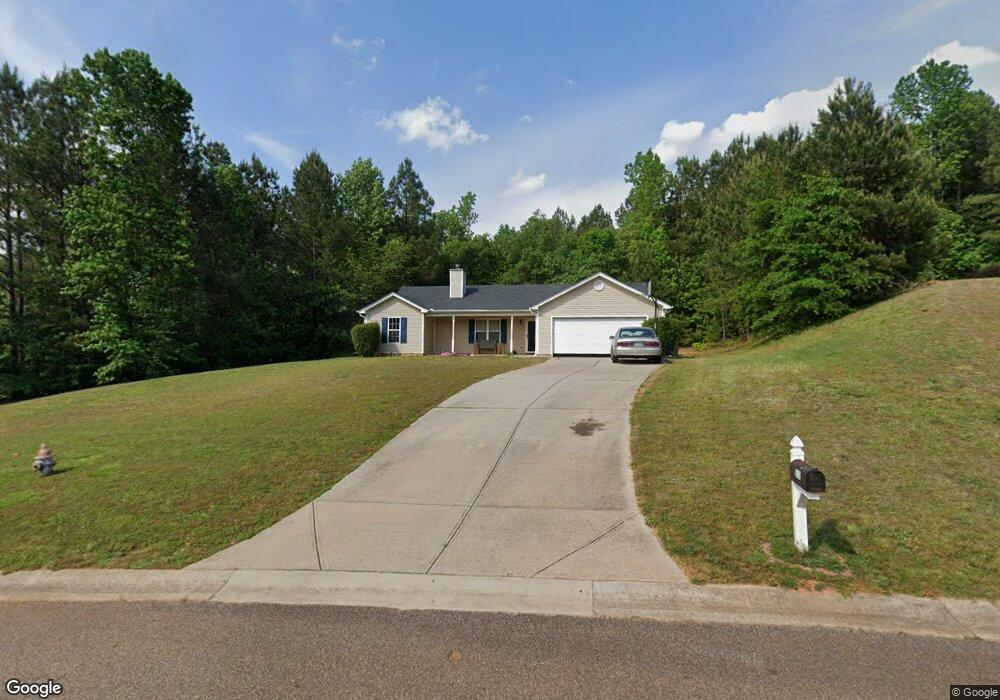
2031 Kirkland Cir Statham, GA 30666
Estimated Value: $288,000 - $318,394
3
Beds
2
Baths
1,414
Sq Ft
$212/Sq Ft
Est. Value
About This Home
This home is located at 2031 Kirkland Cir, Statham, GA 30666 and is currently estimated at $300,349, approximately $212 per square foot. 2031 Kirkland Cir is a home located in Barrow County with nearby schools including Statham Elementary School, Bear Creek Middle School, and Winder-Barrow High School.
Ownership History
Date
Name
Owned For
Owner Type
Purchase Details
Closed on
Jan 8, 2010
Sold by
Taylor Bean & Whitaker Mtg
Bought by
Martin Travis M
Current Estimated Value
Home Financials for this Owner
Home Financials are based on the most recent Mortgage that was taken out on this home.
Original Mortgage
$89,285
Outstanding Balance
$58,173
Interest Rate
4.8%
Mortgage Type
New Conventional
Estimated Equity
$242,176
Purchase Details
Closed on
Feb 3, 2009
Sold by
Sudberry Brian and Sudberry Brigitte
Bought by
Taylor Bean & Whitaker Mtg
Purchase Details
Closed on
May 21, 2007
Sold by
Paradigm Const Co
Bought by
Sudberry Brian and Sudberry Brigitte
Home Financials for this Owner
Home Financials are based on the most recent Mortgage that was taken out on this home.
Original Mortgage
$124,299
Interest Rate
6.52%
Mortgage Type
FHA
Purchase Details
Closed on
Dec 19, 2005
Sold by
Daniel'S Crossing Llc
Bought by
Paradigm Construction Company
Purchase Details
Closed on
Aug 26, 2004
Bought by
Daniel'S Crossing Llc
Create a Home Valuation Report for This Property
The Home Valuation Report is an in-depth analysis detailing your home's value as well as a comparison with similar homes in the area
Home Values in the Area
Average Home Value in this Area
Purchase History
| Date | Buyer | Sale Price | Title Company |
|---|---|---|---|
| Martin Travis M | $87,500 | -- | |
| Taylor Bean & Whitaker Mtg | $144,733 | -- | |
| Bean Taylor | -- | -- | |
| Sudberry Brian | $126,300 | -- | |
| Paradigm Construction Company | $1,147,000 | -- | |
| Daniel'S Crossing Llc | -- | -- |
Source: Public Records
Mortgage History
| Date | Status | Borrower | Loan Amount |
|---|---|---|---|
| Open | Martin Travis M | $89,285 | |
| Previous Owner | Sudberry Brian | $124,299 |
Source: Public Records
Tax History Compared to Growth
Tax History
| Year | Tax Paid | Tax Assessment Tax Assessment Total Assessment is a certain percentage of the fair market value that is determined by local assessors to be the total taxable value of land and additions on the property. | Land | Improvement |
|---|---|---|---|---|
| 2024 | $2,717 | $107,561 | $20,400 | $87,161 |
| 2023 | $2,612 | $103,561 | $16,000 | $87,561 |
| 2022 | $2,197 | $74,458 | $16,000 | $58,458 |
| 2021 | $1,963 | $62,446 | $16,000 | $46,446 |
| 2020 | $1,966 | $62,446 | $16,000 | $46,446 |
| 2019 | $1,768 | $54,802 | $16,000 | $38,802 |
| 2018 | $1,779 | $55,842 | $13,200 | $42,642 |
| 2017 | $1,161 | $39,883 | $11,200 | $28,683 |
| 2016 | $1,290 | $40,194 | $11,200 | $28,994 |
| 2015 | $1,305 | $40,504 | $11,200 | $29,304 |
| 2014 | $1,222 | $36,475 | $6,860 | $29,615 |
| 2013 | -- | $35,008 | $6,860 | $28,148 |
Source: Public Records
Map
Nearby Homes
- 2141 Kirkland Dr
- 2075 Georgia Highway 211
- 2075 Highway 211 NE
- 532 Hemlock Dr
- 410 Tori Dr
- 1610 Trey Ln
- The Baxley Plan at Statham Place
- The Landon II Plan at Statham Place
- 29 Nunnally Rd SE
- 2070 Dooley Town Rd
- 133 2nd St
- 1849 Dooley Town Rd
- 364 Pleasant Hill Church Rd
- 1593 Highway 82
- 1816 Oak Spring St
- 364 Pleasant Hill Church Rd SE
- 226 Baker St
- 315 Paige Way
- 197 Pleasant Hill Church Rd SE
- 1679 Atlanta Hwy SE
- 2029 Kirkland Cir
- 2033 Kirkland Cir
- 2142 Kirkland Dr
- 2140 Kirkland Dr
- 2028 Kirkland Cir
- 2032 Kirkland Cir
- 2025 Kirkland Cir
- 2030 Kirkland Cir
- 2030 Kirkland Cir Unit 38
- 2138 Kirkland Dr
- 2026 Kirkland Cir
- 2143 Kirkland Dr
- 2015 Kirkland Cir
- 2019 Kirkland Cir
- 2024 Kirkland Cir
- 2134 Kirkland Dr
- 2022 Kirkland Cir
- 2130 Kirkland Dr Unit 30
- 2130 Kirkland Dr
- 2137 Kirkland Dr Unit 22