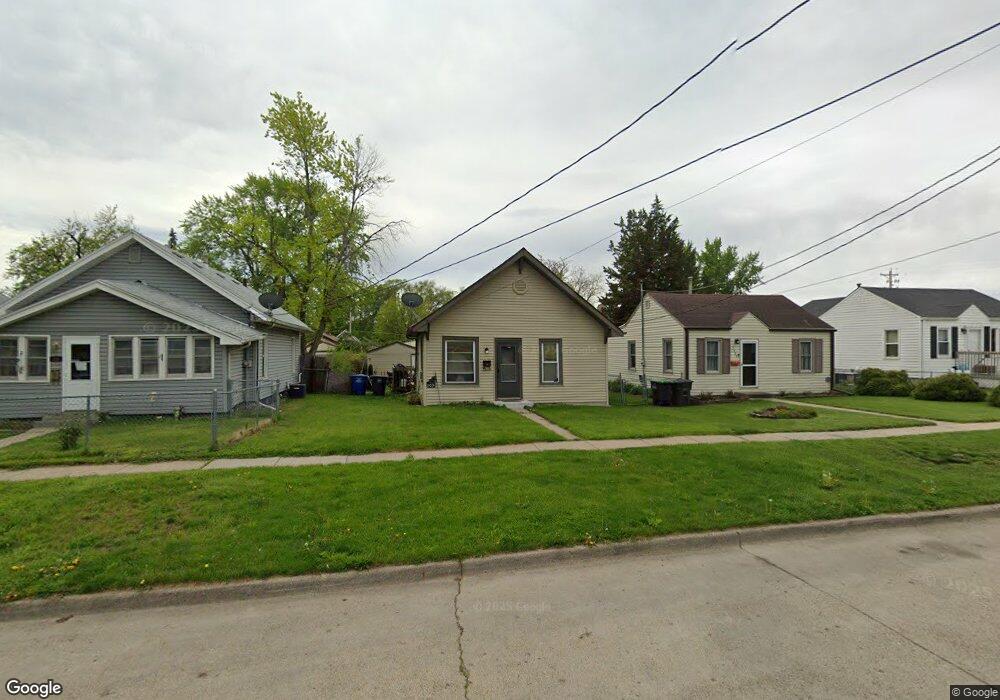
2031 Maple St Des Moines, IA 50317
Fairground NeighborhoodEstimated Value: $79,000 - $129,000
2
Beds
1
Bath
614
Sq Ft
$177/Sq Ft
Est. Value
About This Home
This home is located at 2031 Maple St, Des Moines, IA 50317 and is currently estimated at $108,469, approximately $176 per square foot. 2031 Maple St is a home located in Polk County with nearby schools including Capitol View Elementary School, Hiatt Middle School, and East High School.
Ownership History
Date
Name
Owned For
Owner Type
Purchase Details
Closed on
Oct 21, 2002
Sold by
National City Home Loan Services Inc
Bought by
Andreini Ryan and Andreini Tami
Current Estimated Value
Purchase Details
Closed on
Jun 20, 2002
Sold by
Thornburg Cecil H
Bought by
Altegra Credit Company
Purchase Details
Closed on
Oct 3, 2000
Sold by
Premier Investments Llc
Bought by
Thornburg Cecil H
Home Financials for this Owner
Home Financials are based on the most recent Mortgage that was taken out on this home.
Original Mortgage
$33,600
Interest Rate
10.5%
Purchase Details
Closed on
Dec 19, 1997
Sold by
2031 Maple Land Trust
Bought by
Premier Investments L L C
Purchase Details
Closed on
Aug 1, 1997
Sold by
2031 Maple Land Trust
Bought by
Thornburg Cecil H and Thornburg Nelda C
Purchase Details
Closed on
Jul 11, 1997
Sold by
Gage Thomas E
Bought by
2031 Maple Land Trust
Create a Home Valuation Report for This Property
The Home Valuation Report is an in-depth analysis detailing your home's value as well as a comparison with similar homes in the area
Home Values in the Area
Average Home Value in this Area
Purchase History
| Date | Buyer | Sale Price | Title Company |
|---|---|---|---|
| Andreini Ryan | $9,500 | -- | |
| Altegra Credit Company | $26,817 | -- | |
| Thornburg Cecil H | $34,500 | -- | |
| Premier Investments L L C | -- | -- | |
| Thornburg Cecil H | $34,900 | -- | |
| 2031 Maple Land Trust | $6,000 | -- |
Source: Public Records
Mortgage History
| Date | Status | Borrower | Loan Amount |
|---|---|---|---|
| Previous Owner | Thornburg Cecil H | $33,600 |
Source: Public Records
Tax History
| Year | Tax Paid | Tax Assessment Tax Assessment Total Assessment is a certain percentage of the fair market value that is determined by local assessors to be the total taxable value of land and additions on the property. | Land | Improvement |
|---|---|---|---|---|
| 2025 | $1,470 | $87,400 | $21,800 | $65,600 |
| 2024 | $1,470 | $74,700 | $18,600 | $56,100 |
| 2023 | $1,400 | $74,700 | $18,600 | $56,100 |
| 2022 | $1,390 | $59,400 | $15,200 | $44,200 |
| 2021 | $1,292 | $59,400 | $15,200 | $44,200 |
| 2020 | $1,342 | $51,800 | $13,400 | $38,400 |
| 2019 | $1,210 | $51,800 | $13,400 | $38,400 |
| 2018 | $1,198 | $45,000 | $11,500 | $33,500 |
| 2017 | $1,142 | $45,000 | $11,500 | $33,500 |
| 2016 | $1,112 | $42,200 | $10,700 | $31,500 |
| 2015 | $1,112 | $42,200 | $10,700 | $31,500 |
| 2014 | $1,092 | $41,100 | $10,300 | $30,800 |
Source: Public Records
Map
Nearby Homes
- 2057 Maple St
- 2050 E Grand Ave
- 2024 Capitol Ave
- 824 E 22nd Ct
- 1841 Des Moines St
- 2224 Capitol Ave
- 913 E 23rd St
- 2228 Capitol Ave
- 2323 Maple St
- 2311 Des Moines St
- 807 E 23rd Ct
- 2329 Maple St
- 823 E 23rd Ct
- 2334 Des Moines St
- 1273 E 18th St
- 2343 E Grand Ave
- 2216 Logan Ave
- 1266 E 18th St
- 1807 E Walnut St
- 1411 Delaware Ave
Your Personal Tour Guide
Ask me questions while you tour the home.