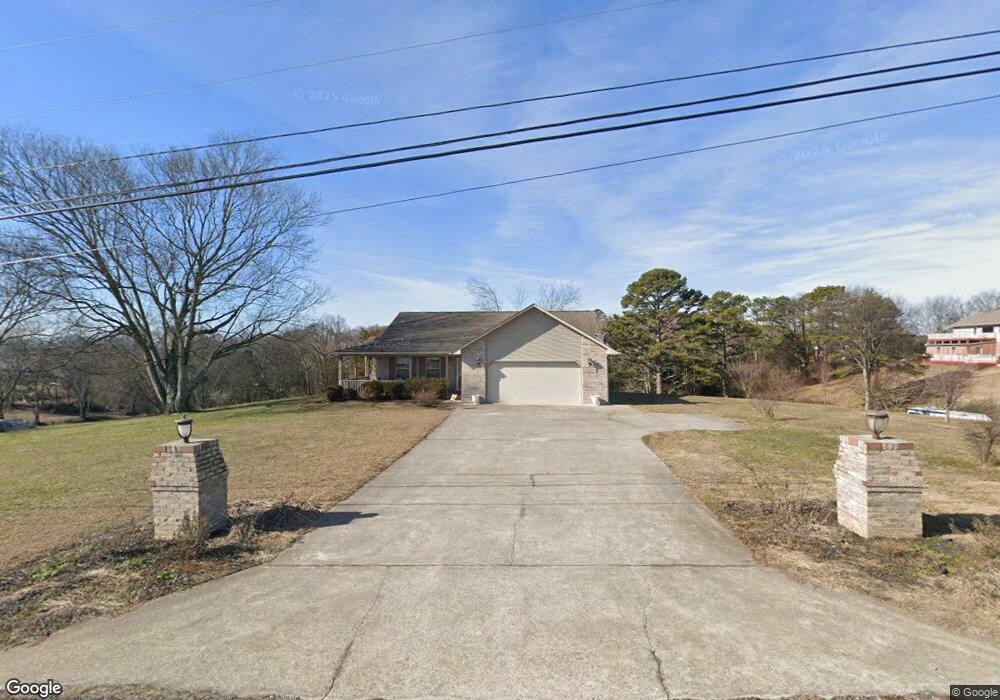
2031 Ranch Rd Dandridge, TN 37725
Estimated Value: $531,000 - $678,000
Studio
2
Baths
1,866
Sq Ft
$327/Sq Ft
Est. Value
About This Home
This home is located at 2031 Ranch Rd, Dandridge, TN 37725 and is currently estimated at $610,276, approximately $327 per square foot. 2031 Ranch Rd is a home located in Jefferson County.
Ownership History
Date
Name
Owned For
Owner Type
Purchase Details
Closed on
Apr 4, 2024
Sold by
Yeany Trust and Yeany Martin F
Bought by
Obrien Tamara
Current Estimated Value
Home Financials for this Owner
Home Financials are based on the most recent Mortgage that was taken out on this home.
Original Mortgage
$503,662
Outstanding Balance
$496,165
Interest Rate
6.9%
Mortgage Type
Credit Line Revolving
Estimated Equity
$114,111
Purchase Details
Closed on
Nov 30, 2018
Sold by
Strange Robert Stephen and Strange Michelle Rence
Bought by
Yeany Martin F and Yeany Constance M
Purchase Details
Closed on
Feb 1, 2018
Sold by
Henderson Barbara F
Bought by
Yeany Martin F and Yeany Constance M
Purchase Details
Closed on
Jan 5, 2005
Sold by
Sirva Relocation Llc
Bought by
Cottick Ronald S
Purchase Details
Closed on
May 14, 1999
Bought by
Henderson Jack Earl and Henderson Barbara F
Purchase Details
Closed on
Feb 2, 1998
Bought by
Henderson Jack Earl and Henderson Barbara F
Purchase Details
Closed on
Nov 7, 1997
Bought by
Glenn Andrew J and Glenn Barbara J
Purchase Details
Closed on
May 15, 1981
Bought by
Pollard Hollis F and Pollard Lori L
Create a Home Valuation Report for This Property
The Home Valuation Report is an in-depth analysis detailing your home's value as well as a comparison with similar homes in the area
Home Values in the Area
Average Home Value in this Area
Purchase History
| Date | Buyer | Sale Price | Title Company |
|---|---|---|---|
| Obrien Tamara | $550,000 | Colonial Title Group | |
| Yeany Martin F | $66,500 | None Available | |
| Yeany Martin F | $310,000 | None Available | |
| Cottick Ronald S | $186,100 | -- | |
| Henderson Jack Earl | $100 | -- | |
| Henderson Jack Earl | $49,000 | -- | |
| Glenn Andrew J | $183,100 | -- | |
| Pollard Hollis F | -- | -- |
Source: Public Records
Mortgage History
| Date | Status | Borrower | Loan Amount |
|---|---|---|---|
| Open | Obrien Tamara | $503,662 |
Source: Public Records
Tax History
| Year | Tax Paid | Tax Assessment Tax Assessment Total Assessment is a certain percentage of the fair market value that is determined by local assessors to be the total taxable value of land and additions on the property. | Land | Improvement |
|---|---|---|---|---|
| 2025 | $2,067 | $144,525 | $45,225 | $99,300 |
| 2023 | $1,837 | $79,875 | $0 | $0 |
| 2022 | $1,749 | $79,875 | $24,125 | $55,750 |
| 2021 | $1,749 | $79,875 | $24,125 | $55,750 |
| 2020 | $1,749 | $79,875 | $24,125 | $55,750 |
| 2019 | $1,749 | $79,875 | $24,125 | $55,750 |
| 2018 | $1,687 | $71,800 | $22,625 | $49,175 |
| 2017 | $1,685 | $71,700 | $22,525 | $49,175 |
| 2016 | $1,685 | $71,700 | $22,525 | $49,175 |
| 2015 | $1,685 | $71,700 | $22,525 | $49,175 |
| 2014 | $1,685 | $71,700 | $22,525 | $49,175 |
Source: Public Records
Map
Nearby Homes
- 206 Eagle View Dr
- 1283 Highway 139 Unit 405c
- 1283 Highway 139 Unit 406-C
- 1269 Highway 139 Unit 304b
- 1269 Highway 139 Unit 302B
- 1269 Tennessee 139 Unit 201B
- 1269 Tennessee 139
- 2160 Ranch Rd
- 2169 Ranch Rd
- 323 Eagle Claw Ln
- 1711 Haire Rd
- 799 Haynes Rd Unit a,b,c
- 2097 Lindsey Rd
- 1902 Fain Cemetery Rd
- 1911 Smokey Meadows Dr
- 539 Morie Rd
- 559 Morie Rd
- 6180 Sycamore Stream Rd
- 6184 Sycamore Stream Rd
- 6192 Sycamore Stream Rd
- 2039 Ranch Rd
- 2027 Ranch Rd
- 2049 Ranch Rd
- 2038 Ranch Rd
- 0 Ranch Rd
- 2030 Ranch Rd
- Lot 6 Ranch Rd
- 2024 Ranch Rd
- 2057 Ranch Rd Unit S/D Lazy M Ranch
- 2057 Ranch Rd
- 2021 Ranch Rd
- 2058 Ranch Rd
- 2058 Ranch Rd
- 1336 Highway 139
- 1370 High St Unit 139
- 2020 Ranch Rd
- 2061 Ranch Rd
- 116 Eagle Nest Ln
- Lot 21 Eagle View
- 243 Eagle View Dr
Your Personal Tour Guide
Ask me questions while you tour the home.