Estimated Value: $150,000 - $206,000
3
Beds
2
Baths
1,288
Sq Ft
$139/Sq Ft
Est. Value
About This Home
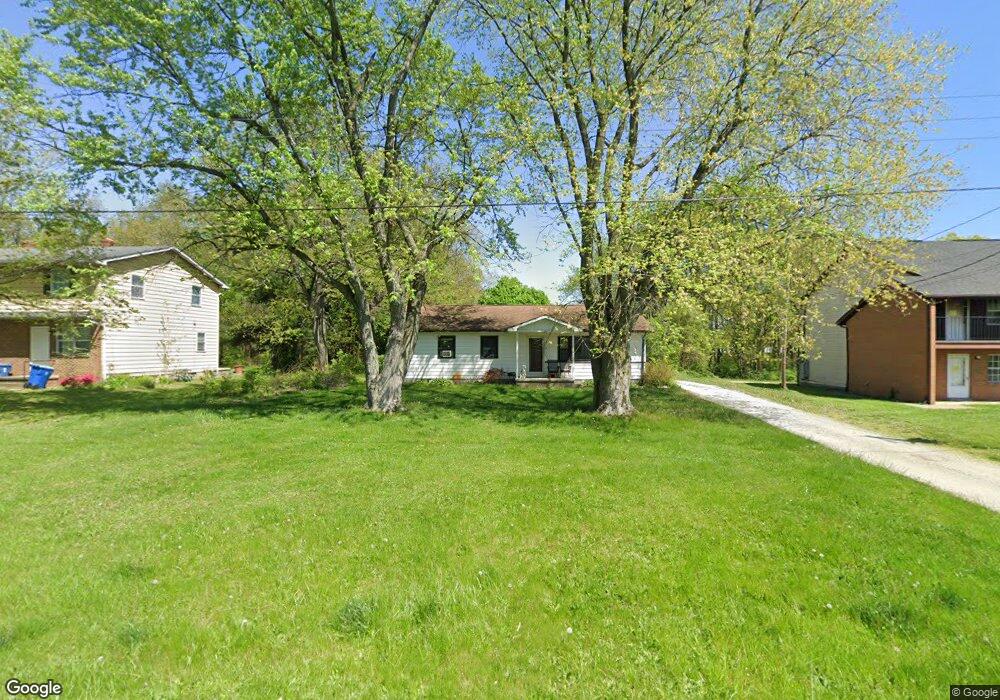
This home is located at 2031 S Gregg Rd, Akron, OH 44319 and is currently estimated at $179,543, approximately $139 per square foot. 2031 S Gregg Rd is a home located in Summit County with nearby schools including Springfield High School, Eagle Elementary, and Chapel Hill Christian School-Green Campus.
Ownership History
Date
Name
Owned For
Owner Type
Purchase Details
Closed on
May 21, 2002
Sold by
Howd Cheryl and Fisher Penny M
Bought by
Conrad Dennis R
Current Estimated Value
Home Financials for this Owner
Home Financials are based on the most recent Mortgage that was taken out on this home.
Original Mortgage
$59,900
Outstanding Balance
$25,542
Interest Rate
7.07%
Estimated Equity
$154,001
Create a Home Valuation Report for This Property
The Home Valuation Report is an in-depth analysis detailing your home's value as well as a comparison with similar homes in the area
Home Values in the Area
Average Home Value in this Area
Purchase History
| Date | Buyer | Sale Price | Title Company |
|---|---|---|---|
| Conrad Dennis R | $89,900 | Midland Commerce Group |
Source: Public Records
Mortgage History
| Date | Status | Borrower | Loan Amount |
|---|---|---|---|
| Open | Conrad Dennis R | $59,900 |
Source: Public Records
Tax History Compared to Growth
Tax History
| Year | Tax Paid | Tax Assessment Tax Assessment Total Assessment is a certain percentage of the fair market value that is determined by local assessors to be the total taxable value of land and additions on the property. | Land | Improvement |
|---|---|---|---|---|
| 2025 | $3,405 | $50,604 | $12,842 | $37,762 |
| 2024 | $3,405 | $50,604 | $12,842 | $37,762 |
| 2023 | $3,405 | $50,604 | $12,842 | $37,762 |
| 2022 | $2,952 | $30,479 | $7,599 | $22,880 |
| 2021 | $2,241 | $30,479 | $7,599 | $22,880 |
| 2020 | $1,955 | $30,480 | $7,600 | $22,880 |
| 2019 | $2,000 | $28,660 | $7,290 | $21,370 |
| 2018 | $2,778 | $28,660 | $7,290 | $21,370 |
| 2017 | $2,581 | $28,660 | $7,290 | $21,370 |
| 2016 | $2,700 | $27,850 | $7,290 | $20,560 |
| 2015 | $2,581 | $27,850 | $7,290 | $20,560 |
| 2014 | $2,708 | $27,850 | $7,290 | $20,560 |
| 2013 | $3,037 | $32,800 | $7,290 | $25,510 |
Source: Public Records
Map
Nearby Homes
- 2188 Stahl Rd
- 1728 S Arlington St
- 1043 Krumroy Rd
- 0 Woodview Dr
- 1511 Acoma Dr
- 738 E Warner Rd
- 1861 & 1863 Highview Ave
- 1645 Hammel St
- 1882 Gless Ave
- 2179 Glenmount Ave
- 1658 Betz Dr
- 1649 Betz Dr
- 1576 Hammel St
- 249 Naomi St
- 739 S Firestone Blvd
- 1731 Highview Ave
- 1698 Sunset Ave
- 1708 Highview Ave
- 1663 Sunset Ave
- 1575 Faye Rd
- 2019 S Gregg Rd
- 2005 S Gregg Rd
- 2032 S Gregg Rd
- 1999 S Gregg Rd
- 2020 S Gregg Rd
- 955 Swartz Rd
- 1985 S Gregg Rd
- 2014 S Gregg Rd
- 973 Swartz Rd
- 2002 S Gregg Rd
- 1975 S Gregg Rd
- 1992 S Gregg Rd
- 954 Swartz Rd
- 1969 S Gregg Rd
- 1982 S Gregg Rd
- 968 Swartz Rd
- 1959 S Gregg Rd
- 1970 S Gregg Rd
- 1951 S Gregg Rd
- 893 Swartz Rd