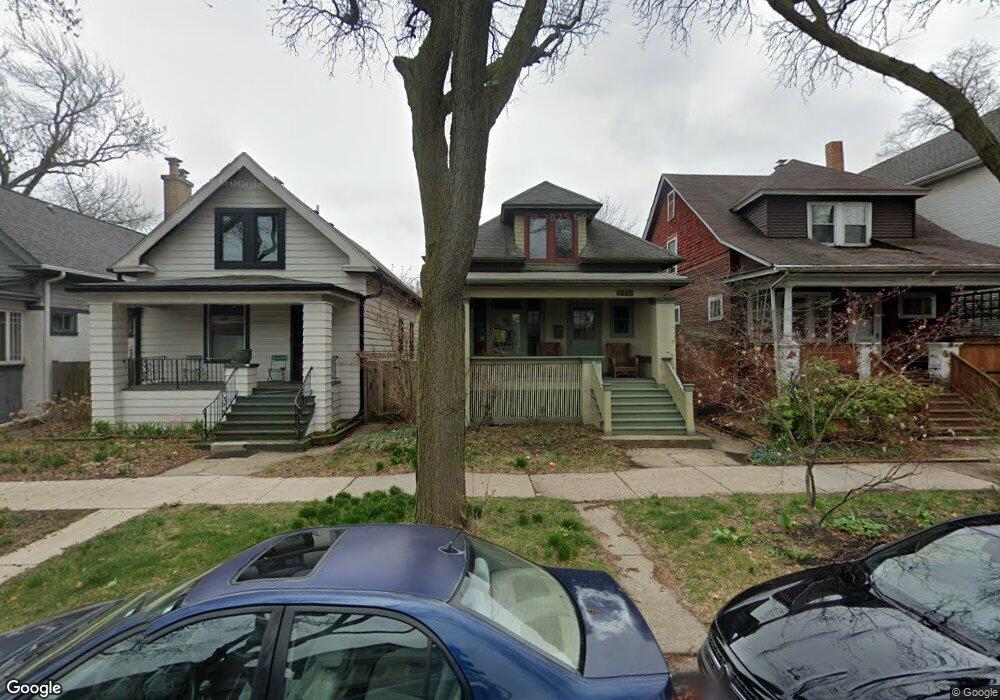
2031 W Chase Ave Chicago, IL 60645
Rogers Park NeighborhoodEstimated Value: $378,000 - $522,000
3
Beds
1
Bath
1,449
Sq Ft
$327/Sq Ft
Est. Value
About This Home
This home is located at 2031 W Chase Ave, Chicago, IL 60645 and is currently estimated at $474,124, approximately $327 per square foot. 2031 W Chase Ave is a home located in Cook County with nearby schools including George Armstrong Elementary School, Sullivan High School, and Acero - Sor Juana Ines de la Cruz School.
Ownership History
Date
Name
Owned For
Owner Type
Purchase Details
Closed on
Dec 12, 2002
Sold by
Sirva Relocation Llc
Bought by
Difrancesco Greg and Davis Mandel
Current Estimated Value
Home Financials for this Owner
Home Financials are based on the most recent Mortgage that was taken out on this home.
Original Mortgage
$247,500
Interest Rate
5.25%
Purchase Details
Closed on
Nov 27, 2002
Sold by
Read John J and Belser Nancy A
Bought by
Sirva Relocation Llc
Home Financials for this Owner
Home Financials are based on the most recent Mortgage that was taken out on this home.
Original Mortgage
$247,500
Interest Rate
5.25%
Purchase Details
Closed on
Apr 21, 1997
Sold by
Newman John H and Newman Regina A
Bought by
Belser Nancy A
Home Financials for this Owner
Home Financials are based on the most recent Mortgage that was taken out on this home.
Original Mortgage
$121,600
Interest Rate
7.92%
Create a Home Valuation Report for This Property
The Home Valuation Report is an in-depth analysis detailing your home's value as well as a comparison with similar homes in the area
Home Values in the Area
Average Home Value in this Area
Purchase History
| Date | Buyer | Sale Price | Title Company |
|---|---|---|---|
| Difrancesco Greg | $275,000 | Ticor Title Insurance | |
| Sirva Relocation Llc | $275,000 | Ticor Title Insurance | |
| Belser Nancy A | $128,000 | -- |
Source: Public Records
Mortgage History
| Date | Status | Borrower | Loan Amount |
|---|---|---|---|
| Previous Owner | Difrancesco Greg | $247,500 | |
| Previous Owner | Belser Nancy A | $121,600 |
Source: Public Records
Tax History Compared to Growth
Tax History
| Year | Tax Paid | Tax Assessment Tax Assessment Total Assessment is a certain percentage of the fair market value that is determined by local assessors to be the total taxable value of land and additions on the property. | Land | Improvement |
|---|---|---|---|---|
| 2024 | $7,107 | $40,001 | $8,708 | $31,293 |
| 2023 | $6,907 | $37,000 | $6,966 | $30,034 |
| 2022 | $6,907 | $37,000 | $6,966 | $30,034 |
| 2021 | $6,771 | $37,000 | $6,966 | $30,034 |
| 2020 | $5,945 | $29,788 | $5,611 | $24,177 |
| 2019 | $5,983 | $33,209 | $5,611 | $27,598 |
| 2018 | $5,881 | $33,209 | $5,611 | $27,598 |
| 2017 | $4,859 | $25,945 | $5,031 | $20,914 |
| 2016 | $4,696 | $25,945 | $5,031 | $20,914 |
| 2015 | $4,274 | $25,945 | $5,031 | $20,914 |
| 2014 | $3,596 | $21,950 | $4,644 | $17,306 |
| 2013 | $3,514 | $21,950 | $4,644 | $17,306 |
Source: Public Records
Map
Nearby Homes
- 7228 N Rogers Ave
- 2109 W Jarvis Ave Unit 1
- 2044 W Jarvis Ave Unit 3G
- 7227 N Damen Ave
- 7223 N Damen Ave
- 2038 W Jarvis Ave Unit 20382D
- 2038 W Jarvis Ave Unit 2F
- 7207 N Damen Ave Unit 2
- 7320 N Rogers Ave Unit 514
- 7102 N Damen Ave Unit 3
- 7234 N Hamilton Ave
- 7344 N Ridge Blvd Unit 5C
- 7074 N Ridge Blvd Unit 1E
- 7348 N Ridge Blvd Unit 16B
- 7070 N Ridge Blvd Unit 1A
- 7252 N Bell Ave
- 2175 W Touhy Ave
- 7315 N Oakley Ave Unit 1A
- 7223 N Oakley Ave Unit 1E
- 2224 W Touhy Ave Unit 3N
- 2035 W Chase Ave
- 2029 W Chase Ave
- 2025 W Chase Ave
- 2037 W Chase Ave Unit 1
- 2037 W Chase Ave Unit 2
- 2037 W Chase Ave
- 2041 W Chase Ave
- 2023 W Chase Ave Unit 715
- 2043 W Chase Ave
- 7246 N Rogers Ave
- 2047 W Chase Ave
- 7242 N Rogers Ave
- 7252 N Rogers Ave
- 7252 N Rogers Ave
- 7238 N Rogers Ave N
- 7250 N Rogers Ave
- 2049 W Chase Ave
- 7230 N Rogers Ave
- 7240 N Rogers Ave
- 2011 W Chase Ave