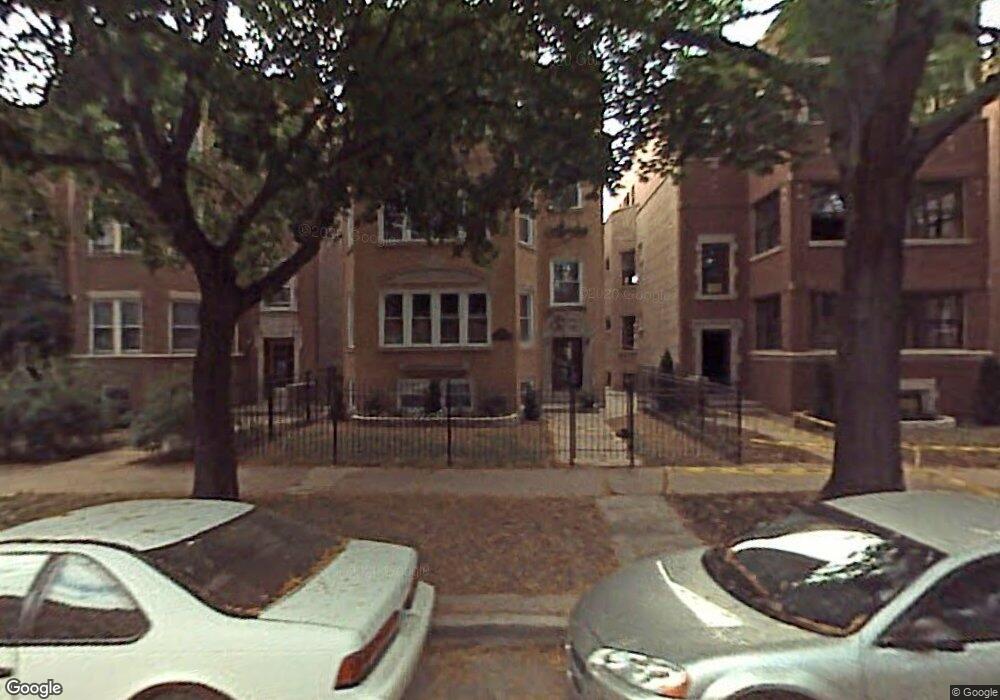
2031 W Farragut Ave Unit 2 Chicago, IL 60625
Bowmanville NeighborhoodEstimated Value: $483,000 - $565,000
3
Beds
2
Baths
1,650
Sq Ft
$317/Sq Ft
Est. Value
About This Home
This home is located at 2031 W Farragut Ave Unit 2, Chicago, IL 60625 and is currently estimated at $523,855, approximately $317 per square foot. 2031 W Farragut Ave Unit 2 is a home located in Cook County with nearby schools including Chappell Elementary School, Amundsen High School, and Rogers Park Montessori School.
Ownership History
Date
Name
Owned For
Owner Type
Purchase Details
Closed on
May 9, 2024
Sold by
Charles Hafner Trust and Hafner Charles
Bought by
Knese Jeffrey and Toffic Alison
Current Estimated Value
Home Financials for this Owner
Home Financials are based on the most recent Mortgage that was taken out on this home.
Original Mortgage
$364,000
Outstanding Balance
$358,648
Interest Rate
6.63%
Mortgage Type
New Conventional
Estimated Equity
$165,207
Purchase Details
Closed on
Oct 11, 2017
Sold by
Hafner Charles A
Bought by
Hafner Charles A and Charles A Hafner Trust
Purchase Details
Closed on
Apr 21, 2006
Sold by
Byrne Matthew M and Wilder Collen M
Bought by
Hafner Charles A
Home Financials for this Owner
Home Financials are based on the most recent Mortgage that was taken out on this home.
Original Mortgage
$326,400
Interest Rate
6.39%
Mortgage Type
Fannie Mae Freddie Mac
Purchase Details
Closed on
Jul 19, 2002
Sold by
2031 W Farragut Llc
Bought by
Byrne Matt and Wilder Colleen
Home Financials for this Owner
Home Financials are based on the most recent Mortgage that was taken out on this home.
Original Mortgage
$241,600
Interest Rate
5.37%
Create a Home Valuation Report for This Property
The Home Valuation Report is an in-depth analysis detailing your home's value as well as a comparison with similar homes in the area
Home Values in the Area
Average Home Value in this Area
Purchase History
| Date | Buyer | Sale Price | Title Company |
|---|---|---|---|
| Knese Jeffrey | $455,000 | None Listed On Document | |
| Hafner Charles A | -- | Attorney | |
| Hafner Charles A | $408,000 | Chicago Title Insurance Co | |
| Byrne Matt | $302,000 | -- |
Source: Public Records
Mortgage History
| Date | Status | Borrower | Loan Amount |
|---|---|---|---|
| Open | Knese Jeffrey | $364,000 | |
| Previous Owner | Hafner Charles A | $326,400 | |
| Previous Owner | Byrne Matt | $241,600 | |
| Closed | Byrne Matt | $30,100 |
Source: Public Records
Tax History Compared to Growth
Tax History
| Year | Tax Paid | Tax Assessment Tax Assessment Total Assessment is a certain percentage of the fair market value that is determined by local assessors to be the total taxable value of land and additions on the property. | Land | Improvement |
|---|---|---|---|---|
| 2024 | $8,584 | $42,207 | $10,241 | $31,966 |
| 2023 | $8,347 | $44,000 | $8,234 | $35,766 |
| 2022 | $8,347 | $44,000 | $8,234 | $35,766 |
| 2021 | $8,178 | $44,000 | $8,234 | $35,766 |
| 2020 | $6,794 | $33,598 | $4,322 | $29,276 |
| 2019 | $6,760 | $37,075 | $4,322 | $32,753 |
| 2018 | $6,645 | $37,075 | $4,322 | $32,753 |
| 2017 | $5,185 | $27,463 | $3,705 | $23,758 |
| 2016 | $5,000 | $27,463 | $3,705 | $23,758 |
| 2015 | $4,552 | $27,463 | $3,705 | $23,758 |
| 2014 | $5,099 | $30,053 | $2,778 | $27,275 |
| 2013 | $4,988 | $30,053 | $2,778 | $27,275 |
Source: Public Records
Map
Nearby Homes
- 2055 W Farragut Ave Unit G
- 5221 N Hoyne Ave Unit 3
- 1968 W Foster Ave Unit D
- 5217 N Winchester Ave Unit 1S
- 1910 W Farragut Ave
- 5349 N Winchester Ave Unit 1
- 1835 W Summerdale Ave
- 2201 W Winona St Unit 2201G
- 1824 W Farragut Ave
- 1824 W Foster Ave Unit 302
- 5015 N Damen Ave
- 2307 W Foster Ave Unit 1
- 2307 W Foster Ave Unit 2
- 2307 W Foster Ave Unit 3
- 1949 W Argyle St Unit 19491
- 1740 W Foster Ave Unit 3R
- 4948 N Winchester Ave
- 5401-5447 N Wolcott Ave
- 1719 W Foster Ave
- 1776 W Winnemac Ave Unit 100
- 2031 W Farragut Ave Unit 3
- 2031 W Farragut Ave Unit 4
- 2031 W Farragut Ave Unit 1
- 2027 W Farragut Ave
- 2035 W Farragut Ave Unit 1
- 2035 W Farragut Ave Unit 3
- 2035 W Farragut Ave Unit 2
- 2035 W Farragut Ave Unit G
- 2037 W Farragut Ave Unit 1
- 2037 W Farragut Ave Unit 2
- 2037 W Farragut Ave Unit 3
- 2037 W Farragut Ave
- 2037 W Farragut Ave Unit 3
- 2037 W Farragut Ave Unit 1
- 2037 W Farragut Ave Unit 2
- 2037 W Farragut Ave
- 2025 W Farragut Ave
- 2025 W Farragut Ave Unit 1
- 2041 W Farragut Ave
- 2041 W Farragut Ave Unit G