Estimated Value: $175,000 - $247,000
3
Beds
1
Bath
1,370
Sq Ft
$155/Sq Ft
Est. Value
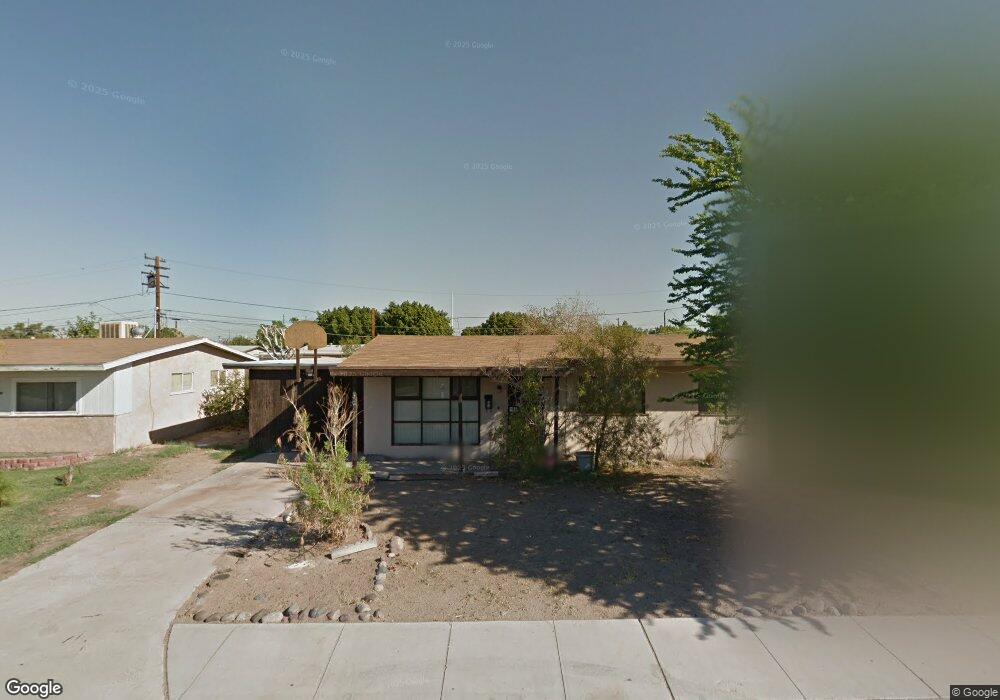
About This Home
This home is located at 2032 E 25th St, Yuma, AZ 85365 and is currently estimated at $212,094, approximately $154 per square foot. 2032 E 25th St is a home located in Yuma County with nearby schools including C. W. McGraw Elementary School, Gila Vista Junior High School, and Kofa High School.
Ownership History
Date
Name
Owned For
Owner Type
Purchase Details
Closed on
Feb 28, 2012
Sold by
Ojeda Alejandro I
Bought by
Gutierrez Nathalie
Current Estimated Value
Home Financials for this Owner
Home Financials are based on the most recent Mortgage that was taken out on this home.
Original Mortgage
$72,026
Outstanding Balance
$50,364
Interest Rate
4.25%
Mortgage Type
FHA
Estimated Equity
$161,730
Purchase Details
Closed on
Nov 8, 2011
Sold by
Ojeda Francisca
Bought by
Ojeda Alejjandro I
Purchase Details
Closed on
Oct 28, 2011
Sold by
Bode Richard and Bode Sandra
Bought by
Ojeda Alejandro I
Purchase Details
Closed on
Oct 13, 2011
Sold by
Hancock Isabel
Bought by
Bode Richard I and Bode Sandra S
Create a Home Valuation Report for This Property
The Home Valuation Report is an in-depth analysis detailing your home's value as well as a comparison with similar homes in the area
Purchase History
| Date | Buyer | Sale Price | Title Company |
|---|---|---|---|
| Gutierrez Nathalie | $73,900 | Chicago Title | |
| Ojeda Alejjandro I | -- | Chicago Title | |
| Ojeda Alejandro I | $39,000 | Chicago Title | |
| Bode Richard I | $36,100 | None Available |
Source: Public Records
Mortgage History
| Date | Status | Borrower | Loan Amount |
|---|---|---|---|
| Open | Gutierrez Nathalie | $72,026 |
Source: Public Records
Tax History
| Year | Tax Paid | Tax Assessment Tax Assessment Total Assessment is a certain percentage of the fair market value that is determined by local assessors to be the total taxable value of land and additions on the property. | Land | Improvement |
|---|---|---|---|---|
| 2025 | $1,521 | $13,920 | $3,141 | $10,779 |
| 2024 | $1,470 | $13,257 | $3,061 | $10,196 |
| 2023 | $1,470 | $12,626 | $3,010 | $9,616 |
| 2022 | $1,531 | $12,024 | $2,900 | $9,124 |
| 2021 | $1,624 | $11,557 | $2,353 | $9,204 |
| 2020 | $1,472 | $11,007 | $2,408 | $8,599 |
| 2019 | $1,448 | $10,483 | $2,675 | $7,808 |
| 2018 | $1,386 | $9,990 | $2,602 | $7,388 |
| 2017 | $1,335 | $9,990 | $2,602 | $7,388 |
| 2016 | $1,308 | $9,061 | $2,250 | $6,811 |
| 2015 | $1,184 | $8,780 | $1,383 | $7,397 |
| 2014 | $1,184 | $8,362 | $1,262 | $7,100 |
Source: Public Records
Map
Nearby Homes
- 2488 S Barbara Ave
- 2097 E La Mesa St
- 2457 S Donna Ave
- 2098 E La Mesa St
- 2463 S Olivia Ave
- 1971 E San Marcos Dr
- 1359 E Morrison St
- 2123 E 24th Place Unit 9
- 2123 E 24th Place Unit 70
- 1846 E San Gabriel Dr
- 1956 E San Gabriel Dr
- 1950 E 24th St Unit 22
- 1950 E 24th St Unit 67
- 1950 E 24th St Unit 114
- 1950 E 24th St Unit 151
- 1950 E 24th St Unit 187
- 1950 E 24th St Unit 153
- 1950 E 24th St Unit 150
- 1950 E 24th St Unit 142
- 2135 E 26th Way
- 2038 E 25th St
- 2026 E 25th St
- 2035 E 24th Place
- 2046 E 25th St
- 2020 E 25th St
- 2029 E 24th Place
- 2041 E 24th Place
- 2033 E 25th St
- 2039 E 25th St
- 2027 E 25th St
- 2049 E 24th Place
- 2023 E 24th Place
- 2052 E 25th St
- 2014 E 25th St
- 2047 E 25th St
- 2021 E 25th St
- 2055 E 24th Place
- 2017 E 24th Place
- 2053 E 25th St
- 2053 E 25th St
Your Personal Tour Guide
Ask me questions while you tour the home.