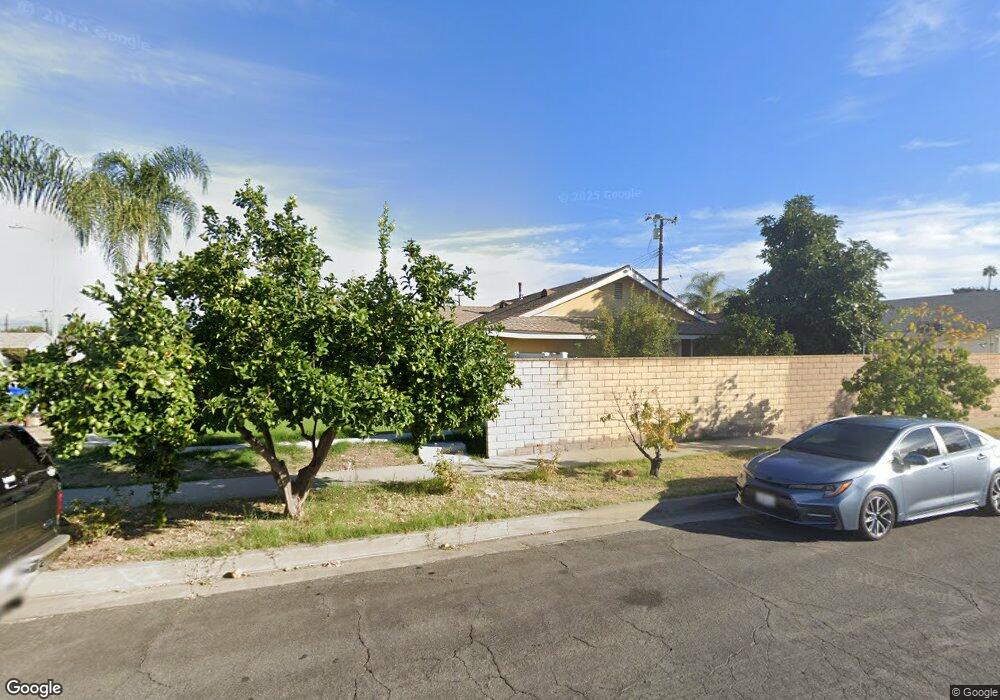
2032 Eadbury Ave Rowland Heights, CA 91748
Estimated Value: $787,282 - $917,000
3
Beds
2
Baths
1,330
Sq Ft
$632/Sq Ft
Est. Value
About This Home
This home is located at 2032 Eadbury Ave, Rowland Heights, CA 91748 and is currently estimated at $840,321, approximately $631 per square foot. 2032 Eadbury Ave is a home located in Los Angeles County with nearby schools including Shelyn Elementary School, Alvarado Intermediate School, and John A. Rowland High School.
Ownership History
Date
Name
Owned For
Owner Type
Purchase Details
Closed on
May 26, 1999
Sold by
Federal Home Loan Mortgage Corporation
Bought by
Graciano Jose and Graciano Maria
Current Estimated Value
Home Financials for this Owner
Home Financials are based on the most recent Mortgage that was taken out on this home.
Original Mortgage
$162,252
Outstanding Balance
$42,650
Interest Rate
7.01%
Mortgage Type
FHA
Estimated Equity
$797,671
Purchase Details
Closed on
Nov 25, 1998
Sold by
Alliance Mtg Company
Bought by
Federal Home Loan Mortgage Corporation
Purchase Details
Closed on
Nov 24, 1998
Sold by
Chang Chao Hua E and Chang Ya Ding T
Bought by
Alliance Mtg Company
Purchase Details
Closed on
Sep 30, 1993
Sold by
Chang Chao Hua Edward and Chang Ya Ding Tina
Bought by
Chang Chao Hua Edward and Chang Ya Ding Tina
Home Financials for this Owner
Home Financials are based on the most recent Mortgage that was taken out on this home.
Original Mortgage
$156,000
Interest Rate
6.94%
Create a Home Valuation Report for This Property
The Home Valuation Report is an in-depth analysis detailing your home's value as well as a comparison with similar homes in the area
Home Values in the Area
Average Home Value in this Area
Purchase History
| Date | Buyer | Sale Price | Title Company |
|---|---|---|---|
| Graciano Jose | $164,000 | Orange Coast Title | |
| Federal Home Loan Mortgage Corporation | -- | First Southwestern Title Co | |
| Alliance Mtg Company | $152,000 | First Southwestern Title Co | |
| Chang Chao Hua Edward | -- | Western Cities Title |
Source: Public Records
Mortgage History
| Date | Status | Borrower | Loan Amount |
|---|---|---|---|
| Open | Graciano Jose | $162,252 | |
| Previous Owner | Chang Chao Hua Edward | $156,000 |
Source: Public Records
Tax History Compared to Growth
Tax History
| Year | Tax Paid | Tax Assessment Tax Assessment Total Assessment is a certain percentage of the fair market value that is determined by local assessors to be the total taxable value of land and additions on the property. | Land | Improvement |
|---|---|---|---|---|
| 2025 | $3,519 | $256,449 | $144,998 | $111,451 |
| 2024 | $3,519 | $251,421 | $142,155 | $109,266 |
| 2023 | $3,408 | $246,492 | $139,368 | $107,124 |
| 2022 | $3,331 | $241,660 | $136,636 | $105,024 |
| 2021 | $3,271 | $236,922 | $133,957 | $102,965 |
| 2019 | $3,174 | $229,897 | $129,985 | $99,912 |
| 2018 | $3,001 | $225,390 | $127,437 | $97,953 |
| 2016 | $2,877 | $216,640 | $122,490 | $94,150 |
| 2015 | $2,832 | $213,387 | $120,651 | $92,736 |
| 2014 | $2,829 | $209,208 | $118,288 | $90,920 |
Source: Public Records
Map
Nearby Homes
- 2124 Camwood Ave
- 1953 Camwood Ave
- 1943 Arcdale Ave
- 19519 Greenwillow Ln
- 1703 Hollandale Ave
- 2366 Pepperdale Dr
- 1560 S Otterbein Ave Unit 153
- 1560 S Otterbein Ave Unit 58
- 1560 S Otterbein Ave Unit 113
- 1560 S Otterbein Ave Unit 170
- 1560 S Otterbein Ave Unit 44
- 18985 Radby St
- 2446 Hillman Ln
- 2270 Paso Real Ave
- 2039 Bolanos Ave
- 2033 Bolanos Ave
- 1560 Otterbein Ave Unit 8
- 1560 Otterbein Ave Unit 12
- 19527 Cronin Dr
- 1842 Bolanos Ave
- 2026 Eadbury Ave
- 2033 Camwood Ave
- 2027 Camwood Ave
- 2020 Eadbury Ave
- 19373 Fadden St
- 19384 Fadden St
- 19388 Fadden St
- 19390 Fadden St
- 2021 Camwood Ave
- 2014 Eadbury Ave
- 2023 Eadbury Ave
- 19372 Fadden St
- 19365 Fadden St
- 2015 Camwood Ave
- 2017 Eadbury Ave
- 19364 Fadden St
- 19381 Dairen St
- 2008 Eadbury Ave
- 19387 Dairen St
- 19375 Dairen St