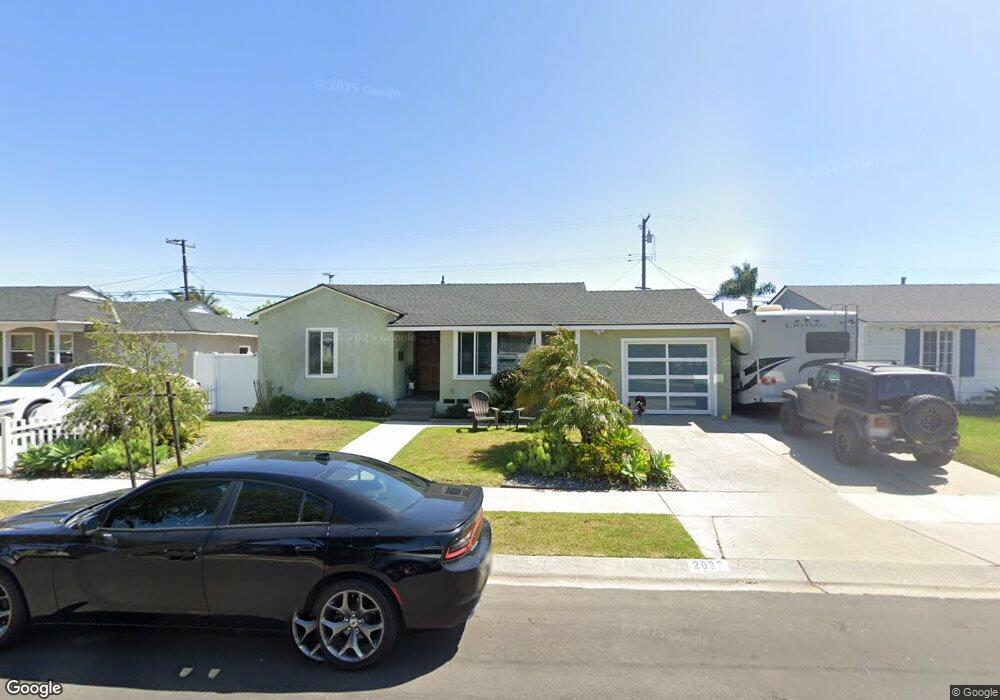
2032 Middlebrook Rd Torrance, CA 90501
Estimated Value: $845,170 - $1,101,000
2
Beds
1
Bath
858
Sq Ft
$1,121/Sq Ft
Est. Value
About This Home
This home is located at 2032 Middlebrook Rd, Torrance, CA 90501 and is currently estimated at $961,793, approximately $1,120 per square foot. 2032 Middlebrook Rd is a home located in Los Angeles County with nearby schools including John Adams Elementary School, J. H. Hull Middle School, and Torrance High School.
Ownership History
Date
Name
Owned For
Owner Type
Purchase Details
Closed on
Dec 9, 2014
Sold by
Riehlman Philin Oscar
Bought by
The Philip & Dayla Riehlman Family Trust
Current Estimated Value
Purchase Details
Closed on
Sep 18, 2006
Sold by
Riehlman Philip Oscar and Riehlman Dayla Ann
Bought by
Riehlman Philip Oscar
Home Financials for this Owner
Home Financials are based on the most recent Mortgage that was taken out on this home.
Original Mortgage
$83,000
Outstanding Balance
$49,463
Interest Rate
6.53%
Mortgage Type
Stand Alone Second
Estimated Equity
$912,330
Purchase Details
Closed on
Jun 22, 1999
Sold by
Trust Radi Norman G And Hazel O Trs Radi
Bought by
Reihlman Philip Oscar
Home Financials for this Owner
Home Financials are based on the most recent Mortgage that was taken out on this home.
Original Mortgage
$215,100
Outstanding Balance
$59,494
Interest Rate
7.64%
Estimated Equity
$902,299
Purchase Details
Closed on
Nov 15, 1994
Sold by
Burrescia Brian
Bought by
Burrescia Sam
Create a Home Valuation Report for This Property
The Home Valuation Report is an in-depth analysis detailing your home's value as well as a comparison with similar homes in the area
Home Values in the Area
Average Home Value in this Area
Purchase History
| Date | Buyer | Sale Price | Title Company |
|---|---|---|---|
| The Philip & Dayla Riehlman Family Trust | -- | None Available | |
| Riehlman Philip Oscar | -- | None Available | |
| Riehlman Philip Oscar | -- | None Available | |
| Reihlman Philip Oscar | $239,000 | American Title Co | |
| Burrescia Sam | -- | -- |
Source: Public Records
Mortgage History
| Date | Status | Borrower | Loan Amount |
|---|---|---|---|
| Open | Riehlman Philip Oscar | $83,000 | |
| Open | Reihlman Philip Oscar | $215,100 |
Source: Public Records
Tax History
| Year | Tax Paid | Tax Assessment Tax Assessment Total Assessment is a certain percentage of the fair market value that is determined by local assessors to be the total taxable value of land and additions on the property. | Land | Improvement |
|---|---|---|---|---|
| 2025 | $4,284 | $367,314 | $293,858 | $73,456 |
| 2024 | $4,284 | $360,113 | $288,097 | $72,016 |
| 2023 | $4,207 | $353,053 | $282,449 | $70,604 |
| 2022 | $4,149 | $346,131 | $276,911 | $69,220 |
| 2021 | $4,071 | $339,345 | $271,482 | $67,863 |
| 2019 | $3,953 | $329,282 | $263,431 | $65,851 |
| 2018 | $3,808 | $322,826 | $258,266 | $64,560 |
| 2016 | $3,637 | $310,292 | $248,238 | $62,054 |
| 2015 | $3,557 | $305,632 | $244,510 | $61,122 |
| 2014 | $3,470 | $299,646 | $239,721 | $59,925 |
Source: Public Records
Map
Nearby Homes
- 2032 W 231st St
- 2011 Reynosa Dr
- 1956 W 231st St
- 22951 Walnut St
- 2720 Gramercy Ave Unit 5
- 2237 W 230th Place
- 23127 Falena Ave
- 2835 Alberta St
- 2848 Alberta St
- 2145 W 235th Place
- 2333 W 230th Place
- 2709 Orange Ave
- 2425 Arlington Ave
- 1617 W 228th St
- 1625 W 227th St
- 2315 Apple Ave
- 2134 W 237th St
- 2362 W 234th St
- 1612 W 226th St
- 1654 Plaza Del Amo
- 2026 Middlebrook Rd
- 2038 Middlebrook Rd
- 2051 W 230th St
- 2045 W 230th St
- 2057 W 230th St
- 2044 Middlebrook Rd
- 2020 Middlebrook Rd
- 2039 W 230th St
- 2063 W 230th St
- 2035 Middlebrook Rd
- 2029 Middlebrook Rd
- 2050 Middlebrook Rd
- 2016 Middlebrook Rd
- 2023 Middlebrook Rd
- 2041 Middlebrook Rd
- 2035 W 230th St
- 2069 W 230th St
- 2017 Middlebrook Rd
- 2047 Middlebrook Rd
- 2010 Middlebrook Rd