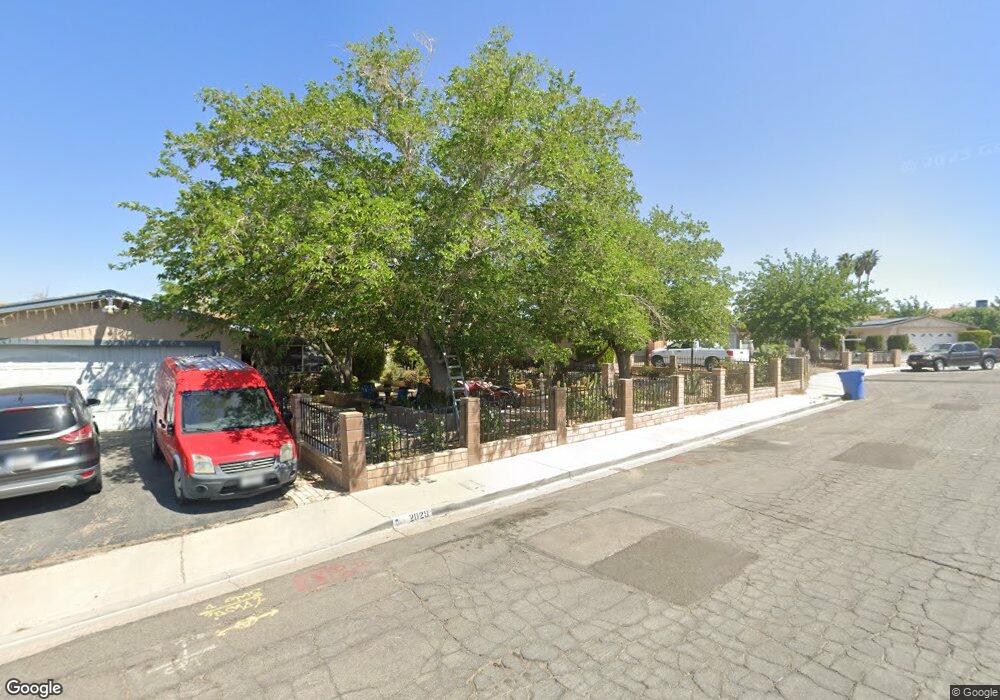
2033 Rushmore Dr Barstow, CA 92311
Estimated Value: $217,000 - $269,000
3
Beds
2
Baths
962
Sq Ft
$259/Sq Ft
Est. Value
About This Home
This home is located at 2033 Rushmore Dr, Barstow, CA 92311 and is currently estimated at $248,851, approximately $258 per square foot. 2033 Rushmore Dr is a home located in San Bernardino County with nearby schools including Montara Elementary School, Barstow Junior High School, and Barstow High School.
Ownership History
Date
Name
Owned For
Owner Type
Purchase Details
Closed on
Sep 10, 2009
Sold by
Francoies Marlon
Bought by
Sanchez Azucena
Current Estimated Value
Home Financials for this Owner
Home Financials are based on the most recent Mortgage that was taken out on this home.
Original Mortgage
$98,138
Interest Rate
5.12%
Mortgage Type
FHA
Purchase Details
Closed on
Apr 22, 2003
Sold by
Underwood Cordelia M
Bought by
Francoies Marlon
Purchase Details
Closed on
Mar 18, 2003
Sold by
Francoies Roberta D
Bought by
Underwood Cordelia M
Purchase Details
Closed on
Mar 17, 2003
Sold by
Underwood William D and Underwood Cordelia M
Bought by
Francoies Marlon
Purchase Details
Closed on
Nov 23, 1999
Sold by
Underwood Cordelia M
Bought by
Underwood William D and Underwood Cordelia M
Purchase Details
Closed on
Jan 29, 1997
Sold by
Francoies Cordelia M and Francoies Cordelia M
Bought by
Underwood Cordelia M and Francoies Roberta D
Create a Home Valuation Report for This Property
The Home Valuation Report is an in-depth analysis detailing your home's value as well as a comparison with similar homes in the area
Home Values in the Area
Average Home Value in this Area
Purchase History
| Date | Buyer | Sale Price | Title Company |
|---|---|---|---|
| Sanchez Azucena | $100,000 | First American Title Company | |
| Francoies Marlon | -- | -- | |
| Underwood Cordelia M | -- | -- | |
| Francoies Marlon | -- | -- | |
| Francoies Marlon | -- | -- | |
| Underwood William D | -- | -- | |
| Underwood Cordelia M | -- | -- |
Source: Public Records
Mortgage History
| Date | Status | Borrower | Loan Amount |
|---|---|---|---|
| Previous Owner | Sanchez Azucena | $98,138 |
Source: Public Records
Tax History Compared to Growth
Tax History
| Year | Tax Paid | Tax Assessment Tax Assessment Total Assessment is a certain percentage of the fair market value that is determined by local assessors to be the total taxable value of land and additions on the property. | Land | Improvement |
|---|---|---|---|---|
| 2025 | $1,453 | $129,021 | $32,256 | $96,765 |
| 2024 | $1,453 | $126,492 | $31,624 | $94,868 |
| 2023 | $1,422 | $124,012 | $31,004 | $93,008 |
| 2022 | $1,416 | $121,580 | $30,396 | $91,184 |
| 2021 | $2,032 | $119,196 | $29,800 | $89,396 |
| 2020 | $1,377 | $117,973 | $29,494 | $88,479 |
| 2019 | $1,305 | $115,660 | $28,916 | $86,744 |
| 2018 | $1,369 | $113,392 | $28,349 | $85,043 |
| 2017 | $1,238 | $111,168 | $27,793 | $83,375 |
| 2016 | $1,223 | $108,988 | $27,248 | $81,740 |
| 2015 | $1,198 | $107,351 | $26,839 | $80,512 |
| 2014 | $1,190 | $105,248 | $26,313 | $78,935 |
Source: Public Records
Map
Nearby Homes
- 2013 Rushmore Dr
- 0 E Rimrock Rd
- 1000 Windy Pass Unit Spc 146
- 1000 Windy Pass Unit 61
- 1000 Windy Pass Unit 95
- 1000 Windy Pass Unit 130
- 761 Upton Dr
- 913 Wren Ct
- 1624 Forane St
- 761 Rimrock Rd
- 1504 Church St
- 1517 De Anza St
- 1020 Monterey Ave
- 500 Mcbroom Ave
- 1537 De Anza St
- 433 Oakmont Dr
- 37 Rimrock Rd
- 1230 Sunshine Dr
- 0 De Anza St
- 1612 De Anza St
- 2029 Rushmore Dr
- 2025 Rushmore Dr
- 1120 Broadway Ct
- 2041 Rushmore Dr
- 2032 Rushmore Dr
- 2028 Rushmore Dr
- 1119 Broadway Ct
- 2021 Rushmore Dr
- 1116 Bryce Ln
- 1124 Broadway Ct
- 2024 Rushmore Dr
- 1112 Bryce Ln
- 1123 Broadway Ct
- 2017 Rushmore Dr
- 2020 Rushmore Dr
- 1108 Bryce Ln
- 1137 Broadway Ave
- 2033 Yellowstone Dr
- 1133 Broadway Ave
- 1128 Broadway Ct