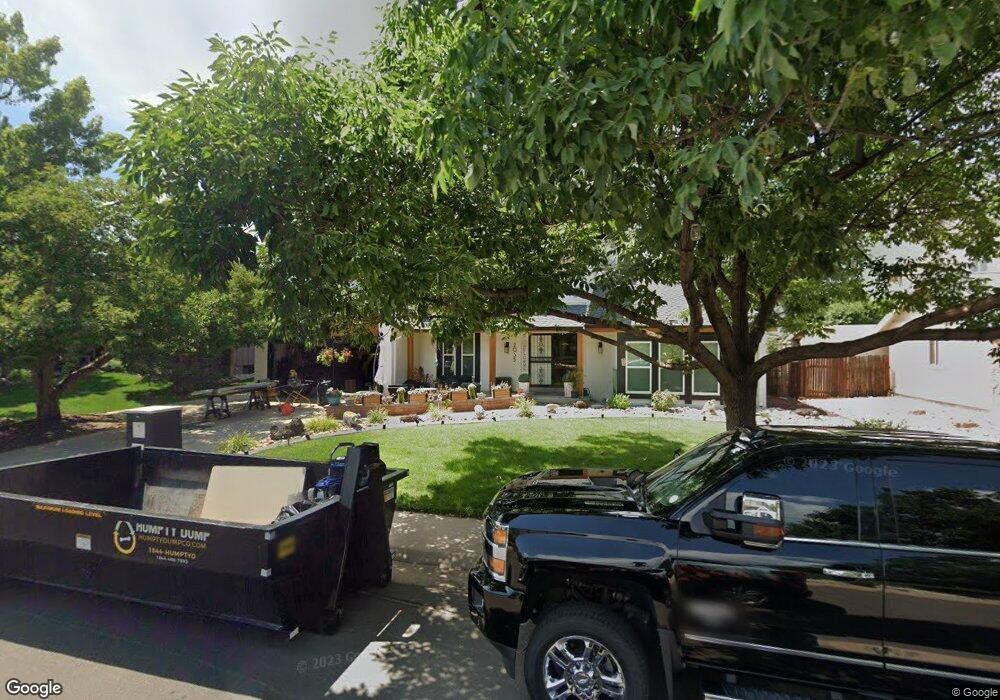
2033 S Moline Way Aurora, CO 80014
Village East NeighborhoodEstimated Value: $556,618 - $612,000
4
Beds
4
Baths
2,384
Sq Ft
$244/Sq Ft
Est. Value
About This Home
This home is located at 2033 S Moline Way, Aurora, CO 80014 and is currently estimated at $580,655, approximately $243 per square foot. 2033 S Moline Way is a home located in Arapahoe County with nearby schools including Ponderosa Elementary School, Prairie Middle School, and Overland High School.
Ownership History
Date
Name
Owned For
Owner Type
Purchase Details
Closed on
Oct 26, 2015
Sold by
Leier Laura D and Chester Kyle L
Bought by
Leier Laura D
Current Estimated Value
Purchase Details
Closed on
Jun 22, 2006
Sold by
Lachata Michael C and Lachata Laura L
Bought by
Leier Laura D and Chester Kyle L
Home Financials for this Owner
Home Financials are based on the most recent Mortgage that was taken out on this home.
Original Mortgage
$260,100
Outstanding Balance
$148,729
Interest Rate
6.37%
Mortgage Type
Purchase Money Mortgage
Estimated Equity
$431,926
Purchase Details
Closed on
Apr 25, 1990
Sold by
Conversion Arapco
Bought by
Lachata Laura L Lachata Michael C
Purchase Details
Closed on
Feb 1, 1979
Sold by
Conversion Arapco
Bought by
Conversion Arapco
Purchase Details
Closed on
Jul 4, 1776
Bought by
Conversion Arapco
Create a Home Valuation Report for This Property
The Home Valuation Report is an in-depth analysis detailing your home's value as well as a comparison with similar homes in the area
Home Values in the Area
Average Home Value in this Area
Purchase History
| Date | Buyer | Sale Price | Title Company |
|---|---|---|---|
| Leier Laura D | -- | None Available | |
| Leier Laura D | $289,000 | Title America | |
| Lachata Laura L Lachata Michael C | -- | -- | |
| Conversion Arapco | -- | -- | |
| Conversion Arapco | -- | -- |
Source: Public Records
Mortgage History
| Date | Status | Borrower | Loan Amount |
|---|---|---|---|
| Open | Leier Laura D | $260,100 |
Source: Public Records
Tax History
| Year | Tax Paid | Tax Assessment Tax Assessment Total Assessment is a certain percentage of the fair market value that is determined by local assessors to be the total taxable value of land and additions on the property. | Land | Improvement |
|---|---|---|---|---|
| 2025 | $2,830 | $37,106 | -- | -- |
| 2024 | $2,496 | $36,073 | -- | -- |
| 2023 | $2,496 | $36,073 | $0 | $0 |
| 2022 | $2,122 | $29,294 | $0 | $0 |
| 2021 | $2,135 | $29,294 | $0 | $0 |
| 2020 | $2,103 | $29,286 | $0 | $0 |
| 2019 | $2,029 | $29,286 | $0 | $0 |
| 2018 | $1,806 | $24,494 | $0 | $0 |
| 2017 | $1,780 | $24,494 | $0 | $0 |
| 2016 | $1,815 | $23,426 | $0 | $0 |
| 2015 | $1,727 | $23,426 | $0 | $0 |
| 2014 | -- | $15,466 | $0 | $0 |
| 2013 | -- | $19,290 | $0 | $0 |
Source: Public Records
Map
Nearby Homes
- 1968 S Kingston Ct
- 11303 E Warren Ave
- 1958 S Kingston Ct
- 1967 S Kingston Ct
- 11742 E Jewell Place
- 2242 S Moline Ct
- 1977 S Oakland Way
- 2297 S Lima Ct
- 11306 E Colorado Dr
- 1915 S Oakland Way
- 2348 S Lima St
- 2280 S Oswego Way Unit 104
- 2280 S Oswego Way Unit 105
- 1920 S Oswego Way
- 2341 S Kenton St
- 11190 E Wesley Ave
- 10594 E Jewell Ave
- 12076 E Montana Place
- 2218 S Iola St
- 2225 S Iola St
- 2041 S Moline Way
- 2031 S Moline Way
- 2050 S Macon Way
- 2060 S Macon Way
- 2048 S Macon Way
- 2034 S Moline Way
- 2043 S Moline Way
- 2032 S Moline Way Unit 4
- 2021 S Moline Way
- 2042 S Moline Way
- 2011 S Moline Way
- 2068 S Macon Way
- 2024 S Moline Way
- 2044 S Moline Way
- 2040 S Macon Way
- 2022 S Moline Way
- 2055 S Newark Way
- 2001 S Moline Way
- 2070 S Macon Way
- 2035 S Newark Way
Your Personal Tour Guide
Ask me questions while you tour the home.