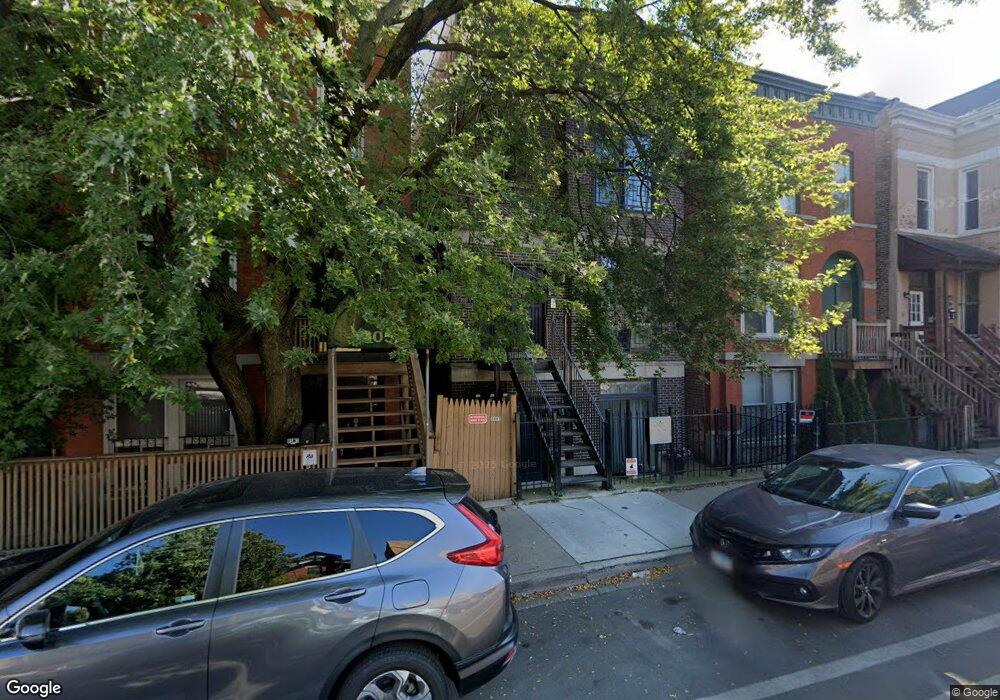
2033 W Armitage Ave Unit 2 Chicago, IL 60647
Bucktown NeighborhoodEstimated Value: $400,000 - $600,000
2
Beds
1
Bath
950
Sq Ft
$485/Sq Ft
Est. Value
About This Home
This home is located at 2033 W Armitage Ave Unit 2, Chicago, IL 60647 and is currently estimated at $460,560, approximately $484 per square foot. 2033 W Armitage Ave Unit 2 is a home located in Cook County with nearby schools including Pulaski Intl School of Chicago, Clemente Community Academy High School, and CICS - Bucktown Campus.
Ownership History
Date
Name
Owned For
Owner Type
Purchase Details
Closed on
May 1, 2009
Sold by
Dallia Michael L and Cogley Catherine T
Bought by
Henderson Jerome R
Current Estimated Value
Home Financials for this Owner
Home Financials are based on the most recent Mortgage that was taken out on this home.
Original Mortgage
$205,600
Interest Rate
4.85%
Mortgage Type
Unknown
Purchase Details
Closed on
Oct 6, 2008
Sold by
Dallia Michael L
Bought by
Dallia Michael L and Cogley Catherine T
Purchase Details
Closed on
Apr 29, 2005
Sold by
Chocol Marc C
Bought by
Dallia Michael L
Home Financials for this Owner
Home Financials are based on the most recent Mortgage that was taken out on this home.
Original Mortgage
$265,050
Interest Rate
5.75%
Mortgage Type
New Conventional
Create a Home Valuation Report for This Property
The Home Valuation Report is an in-depth analysis detailing your home's value as well as a comparison with similar homes in the area
Home Values in the Area
Average Home Value in this Area
Purchase History
| Date | Buyer | Sale Price | Title Company |
|---|---|---|---|
| Henderson Jerome R | $242,000 | Bt | |
| Dallia Michael L | -- | Chicago Title Insurance Co | |
| Dallia Michael L | $279,000 | Chicago Title Insurance Comp |
Source: Public Records
Mortgage History
| Date | Status | Borrower | Loan Amount |
|---|---|---|---|
| Previous Owner | Henderson Jerome R | $205,600 | |
| Previous Owner | Dallia Michael L | $265,050 |
Source: Public Records
Tax History Compared to Growth
Tax History
| Year | Tax Paid | Tax Assessment Tax Assessment Total Assessment is a certain percentage of the fair market value that is determined by local assessors to be the total taxable value of land and additions on the property. | Land | Improvement |
|---|---|---|---|---|
| 2024 | $5,446 | $30,480 | $6,977 | $23,503 |
| 2023 | $5,286 | $29,035 | $3,649 | $25,386 |
| 2022 | $5,286 | $29,035 | $3,649 | $25,386 |
| 2021 | $5,186 | $29,034 | $3,649 | $25,385 |
| 2020 | $4,964 | $25,303 | $3,649 | $21,654 |
| 2019 | $4,874 | $27,599 | $3,649 | $23,950 |
| 2018 | $4,773 | $27,599 | $3,649 | $23,950 |
| 2017 | $5,824 | $30,428 | $3,207 | $27,221 |
| 2016 | $5,594 | $30,428 | $3,207 | $27,221 |
| 2015 | $5,095 | $30,428 | $3,207 | $27,221 |
| 2014 | $3,682 | $22,411 | $2,847 | $19,564 |
| 2013 | $3,598 | $22,411 | $2,847 | $19,564 |
Source: Public Records
Map
Nearby Homes
- 2032 W Homer St
- 2135 W Armitage Ave
- 1951 W Dickens Ave
- 1936 W Armitage Ave Unit 3E
- 2012 W Charleston St
- 1931 N Damen Ave Unit 2S
- 1925 N Damen Ave Unit 1
- 1915 N Damen Ave Unit A
- 2138 N Damen Ave Unit 4
- 2138 N Damen Ave Unit 2
- 2039 W Webster Ave
- 2134 N Winchester Ave Unit B
- 2134 N Winchester Ave Unit A
- 1867 N Leavitt St
- 2236 W Armitage Ave Unit 303
- 2224 N Seeley Ave Unit 2
- 2011 N Oakley Ave
- 2111 W Churchill St Unit 105
- 2233 W Shakespeare Ave Unit 1F
- 2047 N Honore St
- 2033 W Armitage Ave Unit 1
- 2035 W Armitage Ave
- 2031 W Armitage Ave Unit 2
- 2039 W Armitage Ave Unit 1
- 2039 W Armitage Ave
- 2029 W Armitage Ave
- 2027 W Armitage Ave
- 2027 W Armitage Ave Unit 2
- 2027 W Armitage Ave Unit GDN
- 2041 W Armitage Ave Unit 2
- 2041 W Armitage Ave
- 2041 W Armitage Ave Unit 1
- 2023 W Armitage Ave Unit 2
- 2045 W Armitage Ave Unit 3
- 2045 W Armitage Ave Unit 20451
- 2045 W Armitage Ave Unit 20453
- 2045 W Armitage Ave Unit 20452
- 2045 W Armitage Ave Unit A
- 2045 W Armitage Ave Unit C
- 2045 W Armitage Ave Unit 2