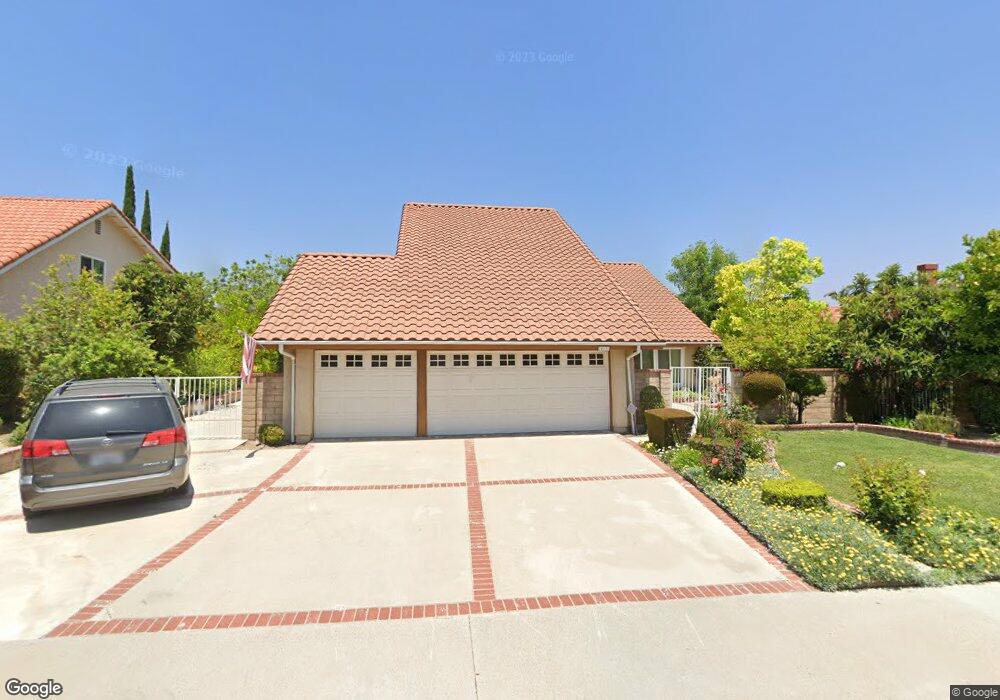
20331 Trails End Rd Walnut, CA 91789
Estimated Value: $1,257,095 - $1,474,000
4
Beds
3
Baths
2,479
Sq Ft
$563/Sq Ft
Est. Value
About This Home
This home is located at 20331 Trails End Rd, Walnut, CA 91789 and is currently estimated at $1,395,024, approximately $562 per square foot. 20331 Trails End Rd is a home located in Los Angeles County with nearby schools including Cyrus J. Morris Elementary School, Suzanne Middle School, and Walnut High School.
Ownership History
Date
Name
Owned For
Owner Type
Purchase Details
Closed on
Aug 2, 2025
Sold by
Chan Haw-Chin and Chang Haw Ching
Bought by
Chang Family Revocable Trust and Chang
Current Estimated Value
Purchase Details
Closed on
Aug 28, 2003
Sold by
Contrafatto Thomas
Bought by
Chang Haw Chin
Home Financials for this Owner
Home Financials are based on the most recent Mortgage that was taken out on this home.
Original Mortgage
$220,000
Interest Rate
4.37%
Mortgage Type
New Conventional
Purchase Details
Closed on
Feb 10, 2000
Sold by
Contrafatto Trust Contrafatto Thomas Tr T And
Bought by
Contrafatto Thomas
Home Financials for this Owner
Home Financials are based on the most recent Mortgage that was taken out on this home.
Original Mortgage
$80,000
Interest Rate
8.26%
Purchase Details
Closed on
May 25, 1995
Sold by
Contrafatto Thomas G and Contrafatto Thomas
Bought by
Contrafatto Thomas and The Thomas & Sharon Contrafatto Revocabl
Create a Home Valuation Report for This Property
The Home Valuation Report is an in-depth analysis detailing your home's value as well as a comparison with similar homes in the area
Home Values in the Area
Average Home Value in this Area
Purchase History
| Date | Buyer | Sale Price | Title Company |
|---|---|---|---|
| Chang Family Revocable Trust | -- | None Listed On Document | |
| Chang Haw Chin | $465,000 | Ticor Title Co | |
| Contrafatto Thomas | -- | First American Title Co | |
| Contrafatto Thomas | -- | -- |
Source: Public Records
Mortgage History
| Date | Status | Borrower | Loan Amount |
|---|---|---|---|
| Previous Owner | Chang Haw Chin | $220,000 | |
| Previous Owner | Contrafatto Thomas | $80,000 |
Source: Public Records
Tax History
| Year | Tax Paid | Tax Assessment Tax Assessment Total Assessment is a certain percentage of the fair market value that is determined by local assessors to be the total taxable value of land and additions on the property. | Land | Improvement |
|---|---|---|---|---|
| 2025 | $8,424 | $661,114 | $361,553 | $299,561 |
| 2024 | $8,424 | $648,152 | $354,464 | $293,688 |
| 2023 | $8,228 | $635,444 | $347,514 | $287,930 |
| 2022 | $8,064 | $622,985 | $340,700 | $282,285 |
| 2021 | $7,914 | $610,770 | $334,020 | $276,750 |
| 2019 | $7,674 | $592,657 | $324,114 | $268,543 |
| 2018 | $7,329 | $581,037 | $317,759 | $263,278 |
| 2016 | $6,805 | $558,476 | $305,421 | $253,055 |
| 2015 | $6,829 | $550,088 | $300,834 | $249,254 |
| 2014 | $6,849 | $539,314 | $294,942 | $244,372 |
Source: Public Records
Map
Nearby Homes
- 792 El Vallencito Dr
- 540 Citadel Dr
- 602 Lone Eagle Rd
- 19910 Tennessee Trail
- 20487 Gartel Dr
- 330 Amberwood Dr
- 1025 N Horseshoe Bend
- 19819 Camino Arroyo
- 180 Ricci Ave
- 20824 Fuero Dr
- 21002 Cornerstone Dr
- 0 Gartel Dr
- 931 Sky Meadow Place
- 19678 Three Oaks Ln
- 805 Silver Valley Trail
- 387 Bourdet St
- 424 S Lemon Ave
- 455 Avenida Esplendor
- 3300 E Millridge Dr
- 3228 La Puente Rd
- 20321 Trails End Rd
- 700 Deer Skin Ln
- 709 Iron Horse Rd
- 715 Iron Horse Rd
- 20315 Trails End Rd
- 710 Deer Skin Ln
- 719 Iron Horse Rd
- 701 Deer Skin Ln
- 20328 Trails End Rd
- 20334 Trails End Rd
- 20322 Trails End Rd
- 718 Deer Skin Ln
- 20342 Trails End Rd
- 727 Iron Horse Rd
- 20311 Trails End Rd
- 709 Deer Skin Ln
- 20314 Trails End Rd
- 708 Iron Horse Rd
- 20350 Trails End Rd
- 714 Iron Horse Rd
Your Personal Tour Guide
Ask me questions while you tour the home.