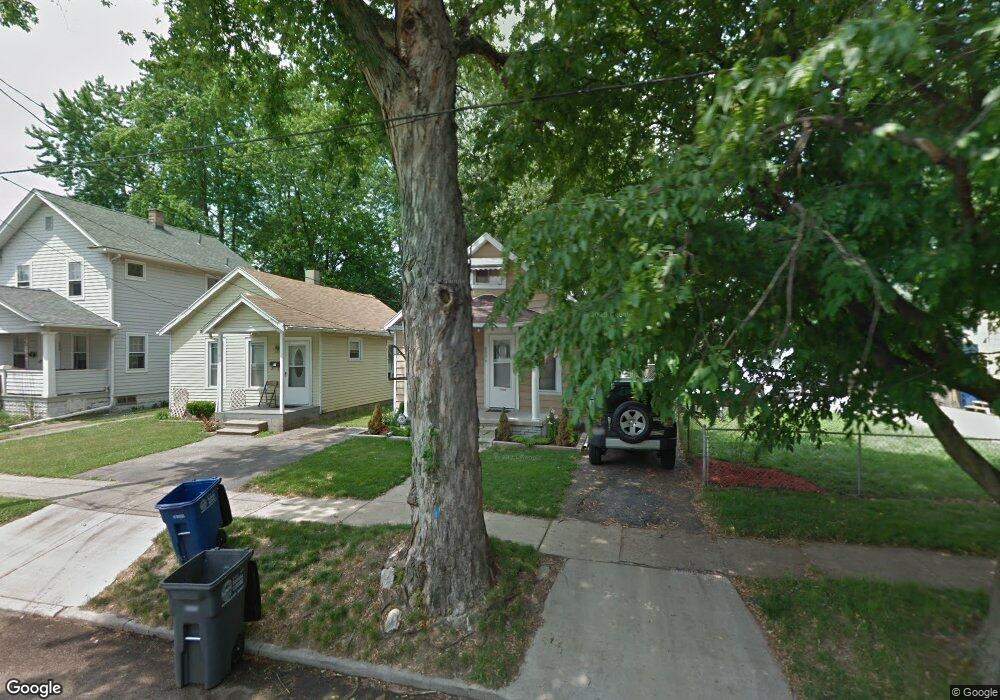
2034 Brussels St Toledo, OH 43613
DeVeaux NeighborhoodEstimated Value: $58,184 - $73,000
2
Beds
1
Bath
696
Sq Ft
$97/Sq Ft
Est. Value
About This Home
This home is located at 2034 Brussels St, Toledo, OH 43613 and is currently estimated at $67,546, approximately $97 per square foot. 2034 Brussels St is a home located in Lucas County with nearby schools including DeVeaux Elementary School, Start High School, and Horizon Science Academy - Toledo High School.
Ownership History
Date
Name
Owned For
Owner Type
Purchase Details
Closed on
Jul 8, 2016
Sold by
Ohio Cashflow Llc
Bought by
Baroni Pia
Current Estimated Value
Purchase Details
Closed on
Jun 13, 2016
Sold by
Boudreaux George A and Boudreaux Laura A
Bought by
Ohio Cashflow Llc
Purchase Details
Closed on
Oct 21, 2004
Sold by
Boudreaux Laura A and Boudreaux George A
Bought by
Boudreaux George A and Boudreaux Laura A
Purchase Details
Closed on
Dec 10, 1997
Sold by
Devany Michael J
Bought by
Devany Laura and Devany Laura A
Purchase Details
Closed on
Aug 14, 1997
Sold by
Monus Reka
Bought by
Devany Laura A
Home Financials for this Owner
Home Financials are based on the most recent Mortgage that was taken out on this home.
Original Mortgage
$31,300
Interest Rate
7.71%
Mortgage Type
FHA
Purchase Details
Closed on
Oct 10, 1991
Sold by
Monus Erzsebet
Purchase Details
Closed on
Aug 23, 1991
Sold by
Monus Monus K K and Monus E
Create a Home Valuation Report for This Property
The Home Valuation Report is an in-depth analysis detailing your home's value as well as a comparison with similar homes in the area
Home Values in the Area
Average Home Value in this Area
Purchase History
| Date | Buyer | Sale Price | Title Company |
|---|---|---|---|
| Baroni Pia | $59,900 | None Available | |
| Ohio Cashflow Llc | $1,600 | None Available | |
| Boudreaux George A | -- | -- | |
| Devany Laura | -- | -- | |
| Devany Laura A | $31,500 | -- | |
| -- | -- | -- | |
| -- | -- | -- |
Source: Public Records
Mortgage History
| Date | Status | Borrower | Loan Amount |
|---|---|---|---|
| Previous Owner | Devany Laura A | $31,300 |
Source: Public Records
Tax History Compared to Growth
Tax History
| Year | Tax Paid | Tax Assessment Tax Assessment Total Assessment is a certain percentage of the fair market value that is determined by local assessors to be the total taxable value of land and additions on the property. | Land | Improvement |
|---|---|---|---|---|
| 2024 | $11,172 | $15,330 | $5,320 | $10,010 |
| 2023 | $971 | $14,490 | $3,640 | $10,850 |
| 2022 | $974 | $14,490 | $3,640 | $10,850 |
| 2021 | $997 | $14,490 | $3,640 | $10,850 |
| 2020 | $1,086 | $14,035 | $3,500 | $10,535 |
| 2019 | $1,056 | $14,035 | $3,500 | $10,535 |
| 2018 | $1,061 | $14,035 | $3,500 | $10,535 |
| 2017 | $2,364 | $13,720 | $3,430 | $10,290 |
| 2016 | $1,063 | $39,200 | $9,800 | $29,400 |
| 2015 | $1,054 | $39,200 | $9,800 | $29,400 |
| 2014 | $1,294 | $13,720 | $3,430 | $10,290 |
| 2013 | $863 | $13,720 | $3,430 | $10,290 |
Source: Public Records
Map
Nearby Homes
- 2026 Berkshire Place
- 1959 Brussels St
- 2041 Brame Place
- 2002 Brame Place
- 2035 Barrows St
- 1921 Brussels St
- 2012 Berdan Ave
- 2050 Berdan Ave
- 1939 Balkan Place
- 1828 Brame Place
- 1834 Berdan Ave
- 3715 Shelbourne Ave
- 1820 Barrows St
- 1818 Barrows St
- 1846 Balkan Place
- 1935 Talbot St
- 2220 Beaufort Ave
- 1815 Berdan Ave
- 1840 Talbot St
- 3718 Sherbrooke Rd
- 2038 Brussels St
- 2032 Brussels St
- 2028 Brussels St
- 2040 Brussels St
- 2026 Brussels St
- 2044 Brussels St
- 2035 Brame Place
- 2022 Brussels St
- 2046 Brussels St
- 2027 Brame Place
- 2020 Brussels St
- 2035 Brussels St
- 2037 Brussels St
- 2023 Brame Place
- 2033 Brussels St
- 2041 Brussels St
- 2047 Brame Place
- 2029 Brussels St
- 2056 Brussels St
- 2054 Brussels St