M
Seller's Agent in 2012
Marcus Roe
West USA Realty


Estimated Value: $307,000 - $438,000
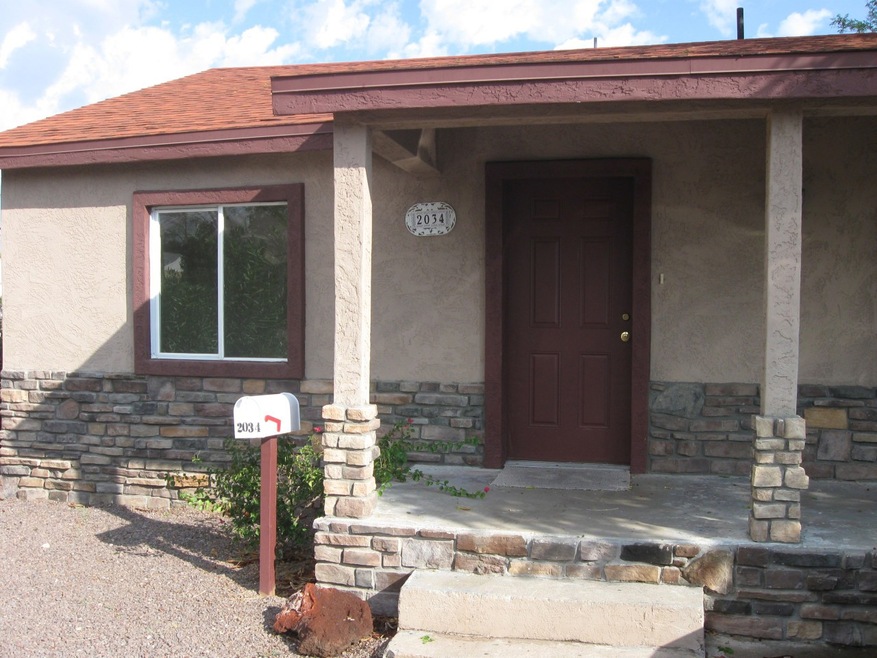
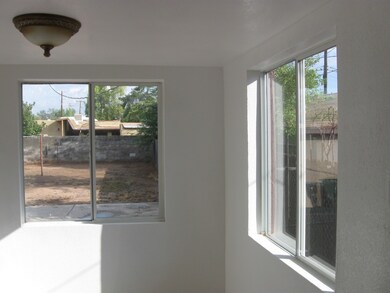
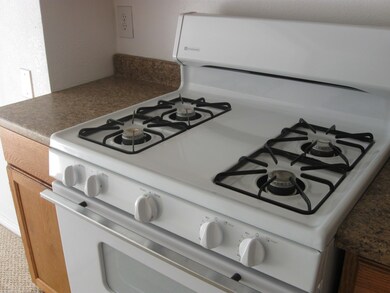
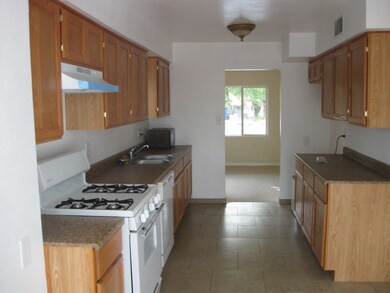
.CAN CLOSE QUICKLY.GUEST HOUSE INCLUDED.TOTAL REMODLE.low utility bills dual pain windows.New hot water heater,copper plumbing.Comes with 1yr home waranty.Srong a/c unit walking distance to shopping and schools.REGULAR SELLER FHA OR VA READY.Rentals if you can find them are about $950 and up.3/2/11 NEW COMPRESSER WITH WARANTY OLD REPUBLIC.
Last Agent to Sell the Property
Marcus Roe
West USA Realty License #SA029204000 Listed on: 10/05/2010
Last Buyer's Agent
Marcus Roe
HomeSmart License #SA029204000
| Date | Buyer | Sale Price | Title Company |
|---|---|---|---|
| Cpak Llc | -- | None Available | |
| Merican Andrea Kay | -- | Dhi Title | |
| Cpak Llc | -- | None Available | |
| Merican Charles Paul | -- | First American Title Ins Co | |
| Merican Charles Paul | $50,000 | First American Title Ins Co | |
| Ferea Ii Kenneth | -- | The Talon Group Arrowhead | |
| Ferea Ii Kenneth | $35,900 | The Talon Group Arrowhead | |
| First Horizon Home Loans | $42,500 | None Available | |
| Steiman Mitchell | -- | U S Title Agency Inc | |
| Steiman Mitchell | $160,000 | U S Title Agency Inc | |
| Atlantic Properties & Investments Llc | -- | None Available | |
| Atlantic Properties & Investments Llc | -- | None Available | |
| 402 Now Llc | $126,008 | Fidelity National Title | |
| Duran Jose Luis | -- | Guaranty Title Agency | |
| Duran Jose Luis | $86,500 | Security Title Agency | |
| Blackman Brian | $27,000 | Security Title Agency |
| Date | Status | Borrower | Loan Amount |
|---|---|---|---|
| Previous Owner | Merican Andrea Kay | $178,500 | |
| Previous Owner | Merican Charles Paul | $45,000 | |
| Previous Owner | Steiman Mitchell | $128,000 | |
| Previous Owner | Duran Jose Luis | $110,500 | |
| Previous Owner | Duran Jose Luis | $85,163 | |
| Previous Owner | Blackman Brian | $27,000 |
| Date | Event | Price | List to Sale | Price per Sq Ft |
|---|---|---|---|---|
| 02/09/2012 02/09/12 | Sold | $50,000 | -16.5% | $38 / Sq Ft |
| 07/22/2011 07/22/11 | Price Changed | $59,900 | -7.8% | $45 / Sq Ft |
| 06/20/2011 06/20/11 | Price Changed | $65,000 | -6.5% | $49 / Sq Ft |
| 06/17/2011 06/17/11 | Price Changed | $69,500 | -0.6% | $53 / Sq Ft |
| 06/02/2011 06/02/11 | Price Changed | $69,900 | -5.5% | $53 / Sq Ft |
| 03/14/2011 03/14/11 | Price Changed | $74,000 | +15.6% | $56 / Sq Ft |
| 02/17/2011 02/17/11 | Price Changed | $63,999 | 0.0% | $49 / Sq Ft |
| 02/10/2011 02/10/11 | Price Changed | $64,000 | -13.5% | $49 / Sq Ft |
| 02/07/2011 02/07/11 | Price Changed | $73,995 | 0.0% | $56 / Sq Ft |
| 01/17/2011 01/17/11 | Price Changed | $73,996 | 0.0% | $56 / Sq Ft |
| 01/10/2011 01/10/11 | Price Changed | $73,997 | 0.0% | $56 / Sq Ft |
| 01/06/2011 01/06/11 | Price Changed | $73,998 | 0.0% | $56 / Sq Ft |
| 01/03/2011 01/03/11 | Price Changed | $73,999 | 0.0% | $56 / Sq Ft |
| 12/30/2010 12/30/10 | Price Changed | $74,000 | +15.6% | $56 / Sq Ft |
| 12/06/2010 12/06/10 | Price Changed | $64,000 | -14.6% | $49 / Sq Ft |
| 12/03/2010 12/03/10 | Price Changed | $74,939 | 0.0% | $57 / Sq Ft |
| 11/29/2010 11/29/10 | Price Changed | $74,940 | 0.0% | $57 / Sq Ft |
| 11/22/2010 11/22/10 | Price Changed | $74,941 | 0.0% | $57 / Sq Ft |
| 11/18/2010 11/18/10 | Price Changed | $74,942 | 0.0% | $57 / Sq Ft |
| 11/08/2010 11/08/10 | Price Changed | $74,943 | 0.0% | $57 / Sq Ft |
| 11/02/2010 11/02/10 | Price Changed | $74,944 | 0.0% | $57 / Sq Ft |
| 10/28/2010 10/28/10 | Price Changed | $74,945 | 0.0% | $57 / Sq Ft |
| 10/22/2010 10/22/10 | Price Changed | $74,946 | 0.0% | $57 / Sq Ft |
| 10/20/2010 10/20/10 | Price Changed | $74,947 | 0.0% | $57 / Sq Ft |
| 10/14/2010 10/14/10 | Price Changed | $74,948 | 0.0% | $57 / Sq Ft |
| 10/09/2010 10/09/10 | Price Changed | $74,949 | 0.0% | $57 / Sq Ft |
| 10/06/2010 10/06/10 | Price Changed | $74,950 | -0.1% | $57 / Sq Ft |
| 10/05/2010 10/05/10 | For Sale | $75,000 | -- | $57 / Sq Ft |
| Year | Tax Paid | Tax Assessment Tax Assessment Total Assessment is a certain percentage of the fair market value that is determined by local assessors to be the total taxable value of land and additions on the property. | Land | Improvement |
|---|---|---|---|---|
| 2025 | $743 | $5,503 | -- | -- |
| 2024 | $707 | $5,241 | -- | -- |
| 2023 | $707 | $29,680 | $5,930 | $23,750 |
| 2022 | $679 | $23,620 | $4,720 | $18,900 |
| 2021 | $696 | $22,030 | $4,400 | $17,630 |
| 2020 | $679 | $19,020 | $3,800 | $15,220 |
| 2019 | $674 | $15,450 | $3,090 | $12,360 |
| 2018 | $660 | $14,150 | $2,830 | $11,320 |
| 2017 | $635 | $11,960 | $2,390 | $9,570 |
| 2016 | $610 | $8,520 | $1,700 | $6,820 |
| 2015 | $568 | $6,750 | $1,350 | $5,400 |
M
Seller's Agent in 2012
Marcus Roe
West USA Realty
Source: Arizona Regional Multiple Listing Service (ARMLS)
MLS Number: 4471329
APN: 117-07-198
Disclaimer: Certain information contained herein is derived from information provided by parties other than Homes.com. All information provided is deemed reliable, but is not guaranteed to be accurate and should be independently verified.
![]() All information should be verified by the recipient and none is guaranteed as accurate by ARMLS
All information should be verified by the recipient and none is guaranteed as accurate by ARMLS
Listing Information presented by local MLS brokerage: Ten-X, local REALTOR®- Arlene Richardson - (888)-952-6393
Ask me questions while you tour the home.