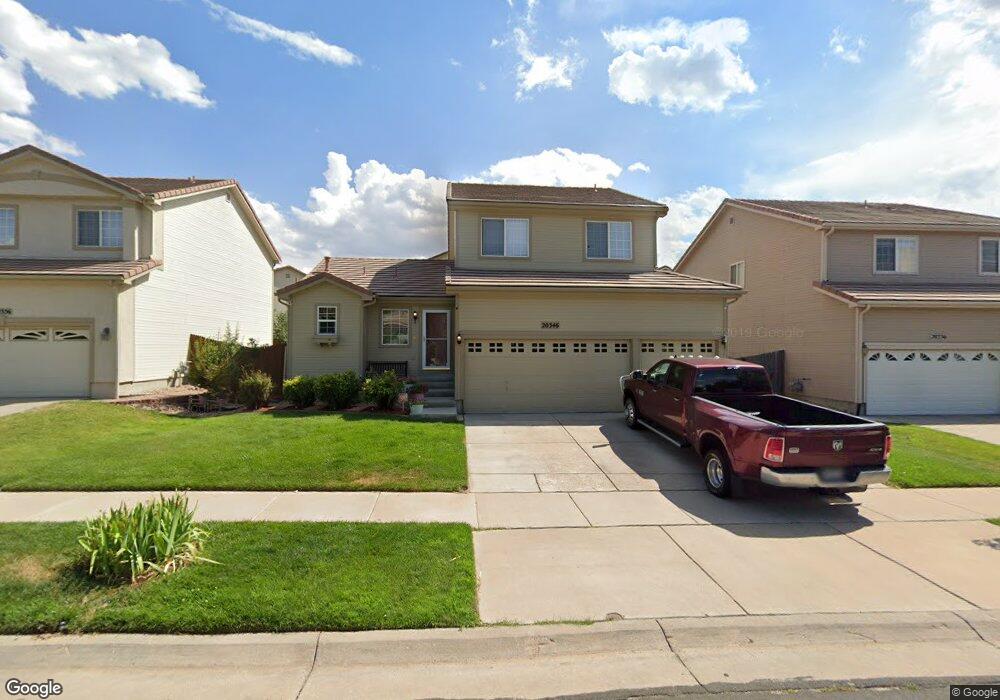
20346 E 41st Place Denver, CO 80249
Green Valley Ranch NeighborhoodEstimated Value: $491,236 - $522,000
3
Beds
3
Baths
2,626
Sq Ft
$193/Sq Ft
Est. Value
About This Home
This home is located at 20346 E 41st Place, Denver, CO 80249 and is currently estimated at $506,809, approximately $192 per square foot. 20346 E 41st Place is a home located in Denver County with nearby schools including Green Valley Elementary School, Pitt-Waller K-8 School, and McGlone Academy.
Ownership History
Date
Name
Owned For
Owner Type
Purchase Details
Closed on
Jan 27, 2021
Sold by
Jenks Craig H and Jenks Michelle
Bought by
Jenks Craig H and Jenks Michele
Current Estimated Value
Home Financials for this Owner
Home Financials are based on the most recent Mortgage that was taken out on this home.
Original Mortgage
$235,000
Outstanding Balance
$172,637
Interest Rate
2.6%
Mortgage Type
New Conventional
Estimated Equity
$334,172
Purchase Details
Closed on
Apr 29, 2011
Sold by
Jenks Craig H
Bought by
Jenks Craig H and Yoder Michele Elaine
Home Financials for this Owner
Home Financials are based on the most recent Mortgage that was taken out on this home.
Original Mortgage
$188,009
Interest Rate
4.82%
Mortgage Type
FHA
Purchase Details
Closed on
Jul 31, 2000
Sold by
Oakwood Homes Llc
Bought by
Robinson Glen E and Robinson Rosemary
Home Financials for this Owner
Home Financials are based on the most recent Mortgage that was taken out on this home.
Original Mortgage
$155,249
Interest Rate
8.15%
Create a Home Valuation Report for This Property
The Home Valuation Report is an in-depth analysis detailing your home's value as well as a comparison with similar homes in the area
Home Values in the Area
Average Home Value in this Area
Purchase History
| Date | Buyer | Sale Price | Title Company |
|---|---|---|---|
| Jenks Craig H | -- | None Available | |
| Jenks Craig H | -- | None Available | |
| Jenks Craig H | $192,900 | Stewart Title | |
| Robinson Glen E | $194,212 | Land Title |
Source: Public Records
Mortgage History
| Date | Status | Borrower | Loan Amount |
|---|---|---|---|
| Open | Jenks Craig H | $235,000 | |
| Closed | Jenks Craig H | $188,009 | |
| Previous Owner | Robinson Glen E | $155,249 |
Source: Public Records
Tax History Compared to Growth
Tax History
| Year | Tax Paid | Tax Assessment Tax Assessment Total Assessment is a certain percentage of the fair market value that is determined by local assessors to be the total taxable value of land and additions on the property. | Land | Improvement |
|---|---|---|---|---|
| 2024 | $2,969 | $31,490 | $1,490 | $30,000 |
| 2023 | $2,818 | $31,490 | $1,490 | $30,000 |
| 2022 | $2,622 | $26,320 | $4,300 | $22,020 |
| 2021 | $2,622 | $27,080 | $4,420 | $22,660 |
| 2020 | $2,392 | $25,370 | $3,680 | $21,690 |
| 2019 | $2,339 | $25,370 | $3,680 | $21,690 |
| 2018 | $2,166 | $22,220 | $2,970 | $19,250 |
| 2017 | $2,160 | $22,220 | $2,970 | $19,250 |
| 2016 | $1,956 | $19,240 | $2,874 | $16,366 |
| 2015 | $1,890 | $19,240 | $2,874 | $16,366 |
| 2014 | $1,505 | $14,590 | $2,388 | $12,202 |
Source: Public Records
Map
Nearby Homes
- 4201 Ireland St
- 20000 E Mitchell Place Unit 71
- 20000 E Mitchell Place Unit 102
- 20000 E Mitchell Place Unit 35
- 20000 E Mitchell Place Unit 34
- 20651 E 42nd Ave
- 20394 Mitchell Place
- 20000 E 40th Ave Unit 4
- 3823 Ireland St
- 20715 E 39th Ave
- 20604 E 38th Place
- 3805 N Himalaya Rd Unit 1
- 20420 Kelly Place
- 20410 Kelly Place
- 20787 E 39th Ave
- 4218 Flanders St
- 20493 E 44th Ave
- 4026 Lisbon St
- 19917 Mitchell Cir
- 19501 E 40th Dr
- 20356 E 41st Place
- 20336 E 41st Place
- 20339 Andrews Place
- 20339 Andrews Place
- 20376 E 41st Place
- 20326 E 41st Place
- 20329 Andrews Place
- 20349 Andrews Place
- 20319 Andrews Place
- 4152 Ireland Ct
- 20367 E 41st Place
- 20306 E 41st Place
- 4149 Jebel St
- 4143 Jebel St
- 20309 Andrews Place
- 20377 E 41st Place
- 4172 Ireland Ct
- 4150 Ireland St
- 4133 Jebel St
- 20387 E 41st Place