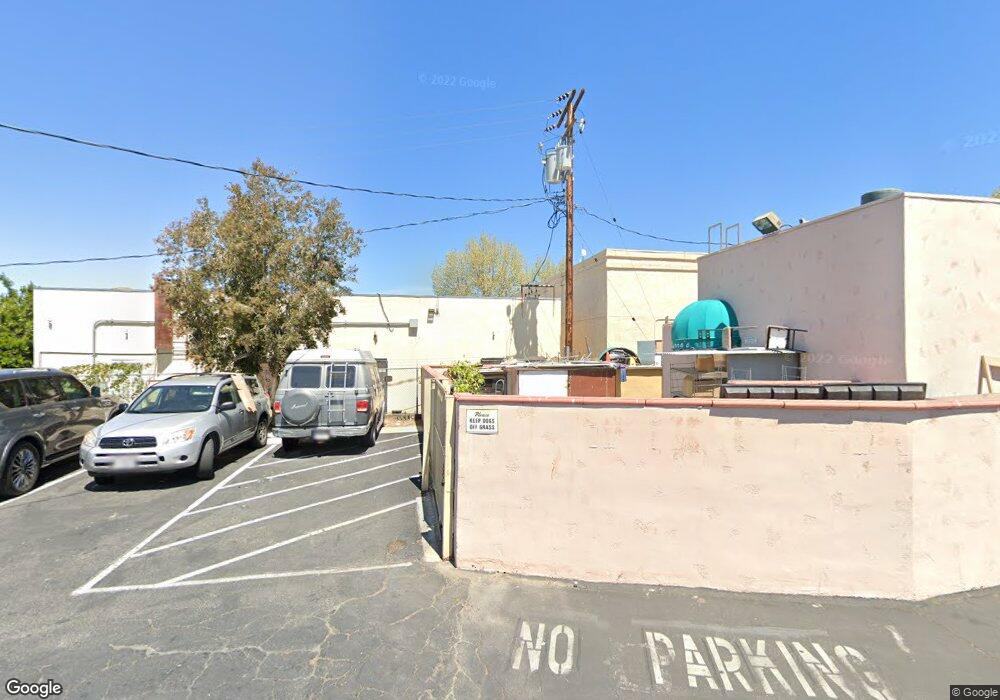
2035 Ave Vst Del Mnte Unit 1 Simi Valley, CA 93063
East Simi Valley NeighborhoodEstimated Value: $387,209 - $533,000
2
Beds
1
Bath
803
Sq Ft
$547/Sq Ft
Est. Value
About This Home
This home is located at 2035 Ave Vst Del Mnte Unit 1, Simi Valley, CA 93063 and is currently estimated at $439,302, approximately $547 per square foot. 2035 Ave Vst Del Mnte Unit 1 is a home located in Ventura County with nearby schools including White Oak Elementary School, Valley View Middle School, and Simi Valley High School.
Ownership History
Date
Name
Owned For
Owner Type
Purchase Details
Closed on
Sep 19, 2002
Sold by
Arc Of Ventura County
Bought by
Association For Retarded Citizens Ventur
Current Estimated Value
Purchase Details
Closed on
Jun 20, 2002
Sold by
Karner David A
Bought by
Arc Of Ventura County
Purchase Details
Closed on
Jun 29, 2000
Sold by
Bingham Jack L and Bingham Melinda A
Bought by
Karner David A
Home Financials for this Owner
Home Financials are based on the most recent Mortgage that was taken out on this home.
Original Mortgage
$120,360
Interest Rate
8.19%
Mortgage Type
VA
Purchase Details
Closed on
Oct 1, 1996
Sold by
Miller Jerry H and Miller Dolores M
Bought by
Bingham Ii Jack Lee and Bingham Melinda Ann
Create a Home Valuation Report for This Property
The Home Valuation Report is an in-depth analysis detailing your home's value as well as a comparison with similar homes in the area
Home Values in the Area
Average Home Value in this Area
Purchase History
| Date | Buyer | Sale Price | Title Company |
|---|---|---|---|
| Association For Retarded Citizens Ventur | $165,000 | -- | |
| Arc Of Ventura County | $165,000 | Chicago Title | |
| Karner David A | $118,500 | Fidelity National Title | |
| Bingham Ii Jack Lee | -- | -- | |
| Miller Jerry H | -- | -- |
Source: Public Records
Mortgage History
| Date | Status | Borrower | Loan Amount |
|---|---|---|---|
| Previous Owner | Karner David A | $120,360 |
Source: Public Records
Tax History Compared to Growth
Tax History
| Year | Tax Paid | Tax Assessment Tax Assessment Total Assessment is a certain percentage of the fair market value that is determined by local assessors to be the total taxable value of land and additions on the property. | Land | Improvement |
|---|---|---|---|---|
| 2025 | $543 | $238,953 | $95,577 | $143,376 |
| 2024 | $543 | $234,268 | $93,703 | $140,565 |
| 2023 | $507 | $229,675 | $91,866 | $137,809 |
| 2022 | $473 | $225,172 | $90,065 | $135,107 |
| 2021 | $442 | $220,757 | $88,299 | $132,458 |
| 2020 | $414 | $218,495 | $87,395 | $131,100 |
| 2019 | $385 | $214,212 | $85,682 | $128,530 |
| 2018 | $363 | $210,012 | $84,002 | $126,010 |
| 2017 | $342 | $205,895 | $82,355 | $123,540 |
| 2016 | $320 | $201,859 | $80,741 | $121,118 |
| 2015 | $299 | $190,000 | $76,000 | $114,000 |
| 2014 | $294 | $169,000 | $68,000 | $101,000 |
Source: Public Records
Map
Nearby Homes
- 2026 Calle la Sombra Unit 2
- 2014 Avenida Placida Unit 4
- 1806 Rory Ln Unit 9
- 1920 Rory Ln Unit 2
- 1948 Rory Ln Unit 5
- 5932 E Los Angeles Ave Unit 39
- 2152 Rockdale Ave
- 2040 Freesia Ave
- 2331 Welcome Ct
- 2037 Freesia Ave
- 5657 Pansy St
- 2367 Saint Clair Ave
- 2238 Connell Ave
- 2024 Tulip Ave
- 2059 Tulip Ave
- 1550 Rory Ln Unit 159
- 1550 Rory Ln Unit 82
- 1550 Rory Ln Unit 239
- 1550 Rory Ln Unit 86
- 1550 Rory Ln Unit 103
- 2035 Ave Vst Del Mnte Unit 3
- 2035 Ave Vst Del Mnte Unit 4
- 2035 Ave Vst Del Mnte Unit 2
- 2027 Ave Vst Del Mnte Unit 4
- 2027 Ave Vst Del Mnte Unit 2
- 2027 Ave Vst Del Mnte Unit 3
- 2027 Ave Vst Del Mnte Unit 1
- 2027 N Avenida Vista Delmonte Unit 2
- 2027 N Avenida Vista Delmonte Unit 4
- 2027 N Avenida Vista Delmonte Unit 1
- 2035 Avenida Vista Delmonte Unit 4
- 2035 N Avenida Vista Del Monte Unit 4
- 2019 N Avenida Vista Del Monte Unit 4
- 2019 N Avenida Vista Del Monte Unit 1
- 2019 Avenue Vista Del Mont N Unit 3
- 2019 N Avenida Vista Del Monte Unit 2
- 2019 Ave Vst Del Mnte Unit 4
- 2019 Ave Vst Del Mnte Unit 3
- 2019 Ave Vst Del Mnte Unit 2
- 2019 Ave Vst Del Mnte Unit 1