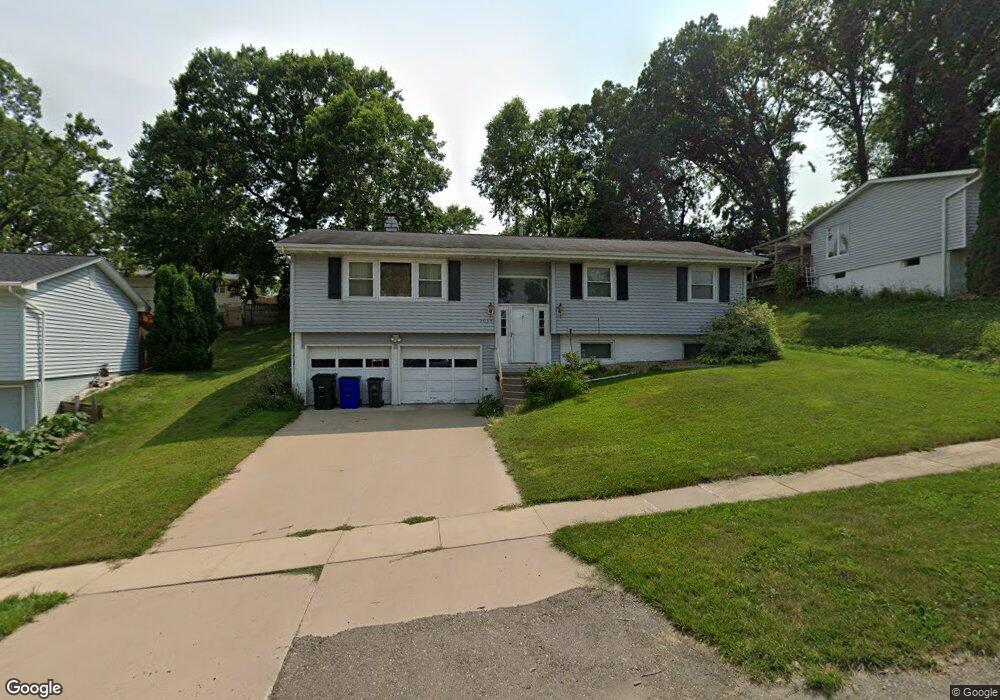
2035 Knollshire Rd NE Cedar Rapids, IA 52402
Estimated Value: $193,000 - $231,000
3
Beds
3
Baths
1,346
Sq Ft
$158/Sq Ft
Est. Value
About This Home
This home is located at 2035 Knollshire Rd NE, Cedar Rapids, IA 52402 and is currently estimated at $213,153, approximately $158 per square foot. 2035 Knollshire Rd NE is a home located in Linn County with nearby schools including Pierce Elementary School, Franklin Middle School, and John F. Kennedy High School.
Ownership History
Date
Name
Owned For
Owner Type
Purchase Details
Closed on
Aug 1, 2017
Sold by
Lipscomb Williams Natalia
Bought by
Lipscomb Williams Natalia
Current Estimated Value
Purchase Details
Closed on
Mar 17, 2004
Sold by
Werth Robert T and Werth Carolyn S
Bought by
Lipscomb Darryl L
Home Financials for this Owner
Home Financials are based on the most recent Mortgage that was taken out on this home.
Original Mortgage
$113,850
Outstanding Balance
$53,618
Interest Rate
5.78%
Mortgage Type
FHA
Estimated Equity
$159,535
Purchase Details
Closed on
Jan 29, 2000
Sold by
Patel Hemant K and Patel Hemant Kumar
Bought by
Werth Robert T
Home Financials for this Owner
Home Financials are based on the most recent Mortgage that was taken out on this home.
Original Mortgage
$95,000
Interest Rate
8.39%
Purchase Details
Closed on
Feb 10, 1998
Sold by
Patel Jennifer L
Bought by
Patel Hemant Kumar
Create a Home Valuation Report for This Property
The Home Valuation Report is an in-depth analysis detailing your home's value as well as a comparison with similar homes in the area
Home Values in the Area
Average Home Value in this Area
Purchase History
| Date | Buyer | Sale Price | Title Company |
|---|---|---|---|
| Lipscomb Williams Natalia | -- | None Available | |
| Lipscomb Darryl L | $114,500 | -- | |
| Werth Robert T | $99,500 | -- | |
| Patel Hemant Kumar | -- | -- |
Source: Public Records
Mortgage History
| Date | Status | Borrower | Loan Amount |
|---|---|---|---|
| Open | Lipscomb Darryl L | $113,850 | |
| Previous Owner | Werth Robert T | $95,000 |
Source: Public Records
Tax History Compared to Growth
Tax History
| Year | Tax Paid | Tax Assessment Tax Assessment Total Assessment is a certain percentage of the fair market value that is determined by local assessors to be the total taxable value of land and additions on the property. | Land | Improvement |
|---|---|---|---|---|
| 2025 | $3,416 | $213,600 | $44,300 | $169,300 |
| 2024 | $3,406 | $193,000 | $40,700 | $152,300 |
| 2023 | $3,406 | $193,000 | $40,700 | $152,300 |
| 2022 | $3,254 | $161,500 | $35,400 | $126,100 |
| 2021 | $3,318 | $157,100 | $33,600 | $123,500 |
| 2020 | $3,318 | $150,400 | $30,100 | $120,300 |
| 2019 | $3,070 | $150,400 | $30,100 | $120,300 |
| 2018 | $2,984 | $142,400 | $28,300 | $114,100 |
| 2017 | $2,845 | $137,100 | $28,300 | $108,800 |
| 2016 | $2,845 | $133,900 | $28,300 | $105,600 |
| 2015 | $2,913 | $136,936 | $31,864 | $105,072 |
| 2014 | $2,728 | $136,936 | $31,864 | $105,072 |
| 2013 | $2,666 | $136,936 | $31,864 | $105,072 |
Source: Public Records
Map
Nearby Homes
- 2041 Birchwood Dr NE
- 1721 34th St NE
- 3008 Circle Hill Ct NE
- 2044 Evergreen St NE
- 3858 Northwood Dr NE
- 2962 Circle Dr NE
- 1611 Hollywood Blvd NE
- 2106 42nd St NE
- 3050 Center Point Rd NE
- 3028 Center Point Rd NE Unit 202
- 2445 Glass Rd NE
- 2400 Brookland Dr NE
- 4216 Marilyn Dr NE
- 3704 Richmond Rd NE
- 1456 Miami Dr NE
- 3711 Oakland Rd NE
- 2611 Brookland Dr NE
- 4309 Benton St NE
- 2906 Oakland Rd NE
- 1759 Applewood Place NE
- 2041 Knollshire Rd NE
- 2034 Birchwood Dr NE
- 2042 Birchwood Dr NE
- 2051 Knollshire Rd NE
- 2028 Birchwood Dr NE
- 3549 Redbud Rd NE
- 2028 Knollshire Rd NE
- 2034 Knollshire Rd NE
- 3541 Redbud Rd NE
- 2042 Knollshire Rd NE
- 2059 Knollshire Rd NE
- 3601 Redbud Rd NE
- 3533 Redbud Rd NE
- 2058 Birchwood Dr NE
- 2050 Knollshire Rd NE
- 3625 Redbud Rd NE
- 2067 Knollshire Rd NE
- 2035 Carolina Dr NE
- 2058 Knollshire Rd NE
- 2100 Birchwood Dr NE