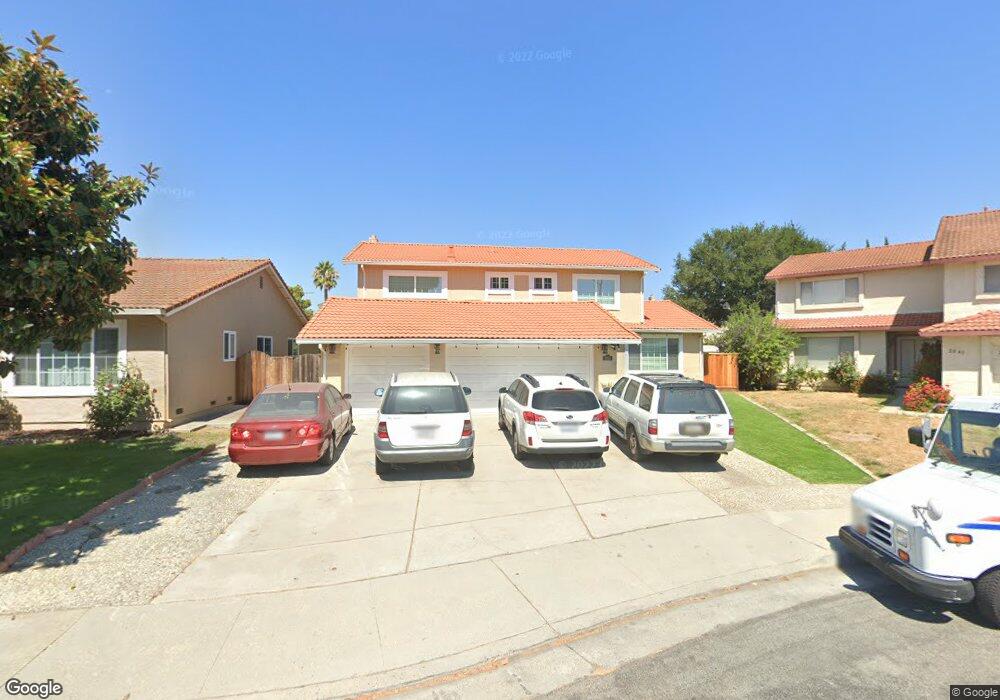
2035 Shellback Place San Jose, CA 95133
Commodore NeighborhoodEstimated Value: $1,671,717 - $1,876,000
5
Beds
3
Baths
2,533
Sq Ft
$693/Sq Ft
Est. Value
About This Home
This home is located at 2035 Shellback Place, San Jose, CA 95133 and is currently estimated at $1,754,929, approximately $692 per square foot. 2035 Shellback Place is a home located in Santa Clara County with nearby schools including Vinci Park Elementary School, Piedmont Middle School, and Independence High School.
Ownership History
Date
Name
Owned For
Owner Type
Purchase Details
Closed on
Sep 21, 1998
Sold by
Ramos Kim T
Bought by
Ramos Antonio P and Ramos Kim T
Current Estimated Value
Home Financials for this Owner
Home Financials are based on the most recent Mortgage that was taken out on this home.
Original Mortgage
$62,000
Interest Rate
6.88%
Mortgage Type
Stand Alone Second
Purchase Details
Closed on
Apr 8, 1998
Sold by
Ramos Antonio P and Ramos Kim T
Bought by
Ramos Kim T
Home Financials for this Owner
Home Financials are based on the most recent Mortgage that was taken out on this home.
Original Mortgage
$276,000
Interest Rate
7.18%
Create a Home Valuation Report for This Property
The Home Valuation Report is an in-depth analysis detailing your home's value as well as a comparison with similar homes in the area
Home Values in the Area
Average Home Value in this Area
Purchase History
| Date | Buyer | Sale Price | Title Company |
|---|---|---|---|
| Ramos Antonio P | -- | Fidelity National Title Ins | |
| Ramos Kim T | -- | Commonwealth Land Title |
Source: Public Records
Mortgage History
| Date | Status | Borrower | Loan Amount |
|---|---|---|---|
| Closed | Ramos Antonio P | $62,000 | |
| Closed | Ramos Kim T | $276,000 |
Source: Public Records
Tax History
| Year | Tax Paid | Tax Assessment Tax Assessment Total Assessment is a certain percentage of the fair market value that is determined by local assessors to be the total taxable value of land and additions on the property. | Land | Improvement |
|---|---|---|---|---|
| 2025 | $10,060 | $688,679 | $309,625 | $379,054 |
| 2024 | $10,060 | $675,176 | $303,554 | $371,622 |
| 2023 | $9,876 | $661,938 | $297,602 | $364,336 |
| 2022 | $9,836 | $648,960 | $291,767 | $357,193 |
| 2021 | $9,516 | $636,237 | $286,047 | $350,190 |
| 2020 | $9,220 | $629,714 | $283,114 | $346,600 |
| 2019 | $8,870 | $617,367 | $277,563 | $339,804 |
| 2018 | $8,744 | $605,263 | $272,121 | $333,142 |
| 2017 | $8,794 | $593,396 | $266,786 | $326,610 |
| 2016 | $8,429 | $581,761 | $261,555 | $320,206 |
| 2015 | $8,332 | $573,024 | $257,627 | $315,397 |
| 2014 | $7,639 | $561,800 | $252,581 | $309,219 |
Source: Public Records
Map
Nearby Homes
- 2043 Shellback Place
- 2083 Bluejacket Way
- 1116 Oakbluff Ct
- 1135 Pandolfi Place
- 1136 Ribisi Cir
- 1034 Ribisi Cir
- 2381 Lava Dr
- 2194 Celeste Ct
- 12280 Mabury Rd
- 783 Opie Ct
- 2505 Dillion Ct Unit 3
- 879 Wyman Way Unit 2
- 1682 Commodore Dr
- 1729 Maysong Ct
- 1062 Rymar Place
- 1055 N Capitol Ave Unit 167
- 1055 N Capitol Ave Unit 180
- 1131 Chen St
- 1967 Nevets Ln
- 2465 Sequester Ct
- 2027 Shellback Place
- 2028 Bluejacket Way
- 2036 Bluejacket Way
- 2051 Shellback Place
- 2019 Shellback Place
- 2020 Bluejacket Way
- 2044 Bluejacket Way
- 2044 Shellback Place
- 2028 Shellback Place
- 2012 Bluejacket Way
- 2034 Shellback Place
- 2052 Bluejacket Way
- 2011 Shellback Place
- 2018 Shellback Place
- 2036 Shellback Place
- 991 Ketch Place
- 985 Ketch Place
- 979 Ketch Place
- 2004 Bluejacket Way
- 2060 Bluejacket Way
Your Personal Tour Guide
Ask me questions while you tour the home.