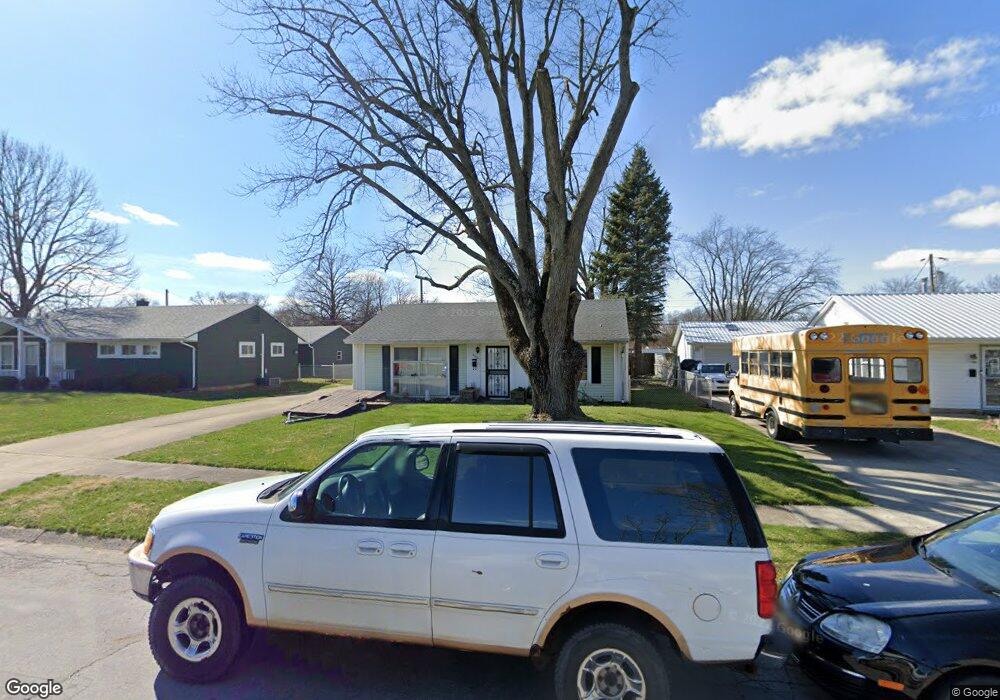
2035 Tanager Rd Springfield, OH 45505
Estimated Value: $125,000 - $164,000
2
Beds
1
Bath
925
Sq Ft
$155/Sq Ft
Est. Value
About This Home
This home is located at 2035 Tanager Rd, Springfield, OH 45505 and is currently estimated at $143,118, approximately $154 per square foot. 2035 Tanager Rd is a home located in Clark County with nearby schools including Kenwood Elementary School, Hayward Middle School, and Springfield High School.
Ownership History
Date
Name
Owned For
Owner Type
Purchase Details
Closed on
May 19, 2016
Sold by
Hall Bradley R and Hall Stephanie
Bought by
Bernath Susan B
Current Estimated Value
Home Financials for this Owner
Home Financials are based on the most recent Mortgage that was taken out on this home.
Original Mortgage
$40,500
Outstanding Balance
$32,167
Interest Rate
3.59%
Mortgage Type
New Conventional
Estimated Equity
$110,951
Purchase Details
Closed on
Jun 13, 2008
Sold by
Myers Madelyn J
Bought by
Hall Bradley R
Home Financials for this Owner
Home Financials are based on the most recent Mortgage that was taken out on this home.
Original Mortgage
$67,500
Interest Rate
6.09%
Mortgage Type
Purchase Money Mortgage
Purchase Details
Closed on
May 9, 2008
Sold by
Mckinney Linda J and Mckinney David
Bought by
Myers Madelyn J
Home Financials for this Owner
Home Financials are based on the most recent Mortgage that was taken out on this home.
Original Mortgage
$67,500
Interest Rate
6.09%
Mortgage Type
Purchase Money Mortgage
Create a Home Valuation Report for This Property
The Home Valuation Report is an in-depth analysis detailing your home's value as well as a comparison with similar homes in the area
Home Values in the Area
Average Home Value in this Area
Purchase History
| Date | Buyer | Sale Price | Title Company |
|---|---|---|---|
| Bernath Susan B | $46,000 | Team Title & Closing Servic | |
| Hall Bradley R | $75,000 | Attorney | |
| Myers Madelyn J | -- | None Available |
Source: Public Records
Mortgage History
| Date | Status | Borrower | Loan Amount |
|---|---|---|---|
| Open | Bernath Susan B | $40,500 | |
| Previous Owner | Hall Bradley R | $67,500 |
Source: Public Records
Tax History Compared to Growth
Tax History
| Year | Tax Paid | Tax Assessment Tax Assessment Total Assessment is a certain percentage of the fair market value that is determined by local assessors to be the total taxable value of land and additions on the property. | Land | Improvement |
|---|---|---|---|---|
| 2024 | $1,275 | $26,450 | $4,950 | $21,500 |
| 2023 | $1,275 | $26,450 | $4,950 | $21,500 |
| 2022 | $1,306 | $26,450 | $4,950 | $21,500 |
| 2021 | $1,110 | $20,760 | $3,860 | $16,900 |
| 2020 | $1,113 | $20,760 | $3,860 | $16,900 |
| 2019 | $1,115 | $20,760 | $3,860 | $16,900 |
| 2018 | $1,052 | $18,810 | $2,900 | $15,910 |
| 2017 | $1,051 | $19,474 | $2,898 | $16,576 |
| 2016 | $1,053 | $19,474 | $2,898 | $16,576 |
| 2015 | $993 | $18,309 | $2,898 | $15,411 |
| 2014 | $989 | $18,309 | $2,898 | $15,411 |
| 2013 | $979 | $18,309 | $2,898 | $15,411 |
Source: Public Records
Map
Nearby Homes
- 2218 Tanager Rd
- 1716 N Sweetbriar Ln
- 1630 S Sweetbriar Ln
- 1815 Beacon St
- 1904 Sunset Ave
- 1554 S Belmont Ave
- Newcastle Plan at Sycamore Ridge
- Pendleton Plan at Sycamore Ridge
- Bellamy Plan at Sycamore Ridge
- Harmony Plan at Sycamore Ridge
- Holcombe Plan at Sycamore Ridge
- 2216 Hackberry St
- 1915 Kenwood Ave
- 1562 Rutland Ave
- 1225 Beacon St
- 1979 Kenton St
- 2008 Kenton St
- 1714 Kenton St
- 2073 Stowe Dr
- 2605 Morton Dr
- 2041 Tanager Rd
- 2031 Tanager Rd
- 2030 Memorial Dr
- 2049 Tanager Rd
- 2026 Memorial Dr
- 2034 Tanager Rd
- 2028 Tanager Rd
- 2040 Tanager Rd
- 2033 Gridley Ct
- 2029 Gridley Ct
- 2018 Memorial Dr
- 2043 Memorial Dr
- 2119 Wrenwood Rd
- 2023 Gridley Ct
- 2102 Tanager Rd
- 2112 Memorial Dr
- 2107 Tanager Rd
- 2036 Gridley Ct
- 2010 Memorial Dr
- 2019 Memorial Dr