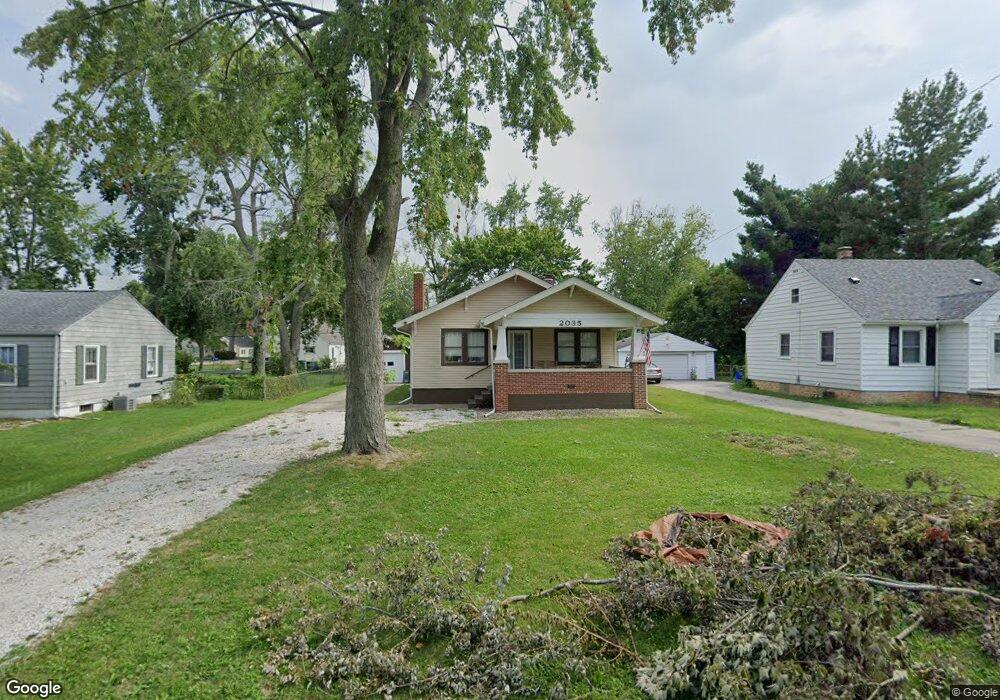
2035 W Leafland Ave Decatur, IL 62522
Fairlawn NeighborhoodEstimated Value: $67,000 - $91,728
2
Beds
1
Bath
2,052
Sq Ft
$40/Sq Ft
Est. Value
About This Home
This home is located at 2035 W Leafland Ave, Decatur, IL 62522 and is currently estimated at $82,682, approximately $40 per square foot. 2035 W Leafland Ave is a home located in Macon County with nearby schools including Stephen Decatur Middle School and Northwest Christian Campus.
Ownership History
Date
Name
Owned For
Owner Type
Purchase Details
Closed on
Jul 29, 2022
Sold by
Christopher Vaughan
Bought by
Sullivan Yessenia and Sullivan Brandon
Current Estimated Value
Home Financials for this Owner
Home Financials are based on the most recent Mortgage that was taken out on this home.
Original Mortgage
$64,837
Outstanding Balance
$62,334
Interest Rate
6.25%
Mortgage Type
New Conventional
Estimated Equity
$20,348
Purchase Details
Closed on
Apr 11, 2022
Sold by
Cox Larry G
Bought by
Vaughen Christopher A
Purchase Details
Closed on
Oct 29, 2019
Sold by
Schaal Cindy A
Bought by
Vaughan Christopher
Purchase Details
Closed on
Jan 4, 2018
Sold by
Hinrichs Heidi Jane
Bought by
Schall Cindy A
Purchase Details
Closed on
May 12, 2010
Sold by
Hinrichs Heidi Jane and Hinrichs Wayne M
Bought by
Hinrichs Heidi Jane
Create a Home Valuation Report for This Property
The Home Valuation Report is an in-depth analysis detailing your home's value as well as a comparison with similar homes in the area
Home Values in the Area
Average Home Value in this Area
Purchase History
| Date | Buyer | Sale Price | Title Company |
|---|---|---|---|
| Sullivan Yessenia | $68,500 | Chiligiris Andrew P | |
| Sullivan Yessenia | $68,500 | Chiligiris Andrew P | |
| Vaughen Christopher A | $18,000 | None Listed On Document | |
| Vaughan Christopher | $38,000 | None Available | |
| Schall Cindy A | $17,500 | -- | |
| Hinrichs Heidi Jane | -- | None Available |
Source: Public Records
Mortgage History
| Date | Status | Borrower | Loan Amount |
|---|---|---|---|
| Open | Sullivan Yessenia | $64,837 | |
| Closed | Sullivan Yessenia | $64,837 |
Source: Public Records
Tax History Compared to Growth
Tax History
| Year | Tax Paid | Tax Assessment Tax Assessment Total Assessment is a certain percentage of the fair market value that is determined by local assessors to be the total taxable value of land and additions on the property. | Land | Improvement |
|---|---|---|---|---|
| 2024 | $2,490 | $25,726 | $3,438 | $22,288 |
| 2023 | $1,873 | $24,815 | $3,316 | $21,499 |
| 2022 | $800 | $13,823 | $3,069 | $10,754 |
| 2021 | $711 | $12,909 | $2,866 | $10,043 |
| 2020 | $139 | $12,310 | $2,733 | $9,577 |
| 2019 | $139 | $12,310 | $2,733 | $9,577 |
| 2018 | $92 | $11,363 | $1,754 | $9,609 |
| 2017 | $899 | $14,578 | $1,801 | $12,777 |
| 2016 | $922 | $14,726 | $1,819 | $12,907 |
| 2015 | $865 | $14,466 | $1,787 | $12,679 |
| 2014 | $798 | $14,322 | $1,769 | $12,553 |
| 2013 | $846 | $14,860 | $1,835 | $13,025 |
Source: Public Records
Map
Nearby Homes
- 2201 W Packard St
- 2195 W Center St
- 1524 N Summit Ave
- 0 Valley View Place
- 1415 N Dennis Ave
- 1675 W Center St
- 1645 W Center St
- 1706 W Division St
- 1451 W Marietta St
- 2125 Clearmont Ave
- 1530 W Cushing St
- 1535 N Mcclellan Ave
- 1319 W Waggoner St
- 2121 Barding Ave
- 2262 Yorkshire Dr
- 1625 W Garfield Ave
- 435 N Summit Ave
- 415 N Summit Ave
- 2406 W Olive St
- 917 N Wilder Ave
- 2025 W Leafland Ave
- 2045 W Leafland Ave
- 1133 N Oakcrest Ave
- 2015 W Leafland Ave
- 2075 W Leafland Ave
- 1132 N Westlawn Ave
- 1127 N Oakcrest Ave
- 1126 N Westlawn Ave
- 2050 W Leafland Ave
- 1121 N Oakcrest Ave
- 2095 W Leafland Ave
- 2058 W Leafland Ave
- 2005 W Leafland Ave
- 2088 W Leafland Ave
- 1120 N Westlawn Ave
- 2092 W Leafland Ave
- 1132 N Oakcrest Ave
- 1115 N Oakcrest Ave
- 1126 N Oakcrest Ave
- 2003 W Leafland Ave