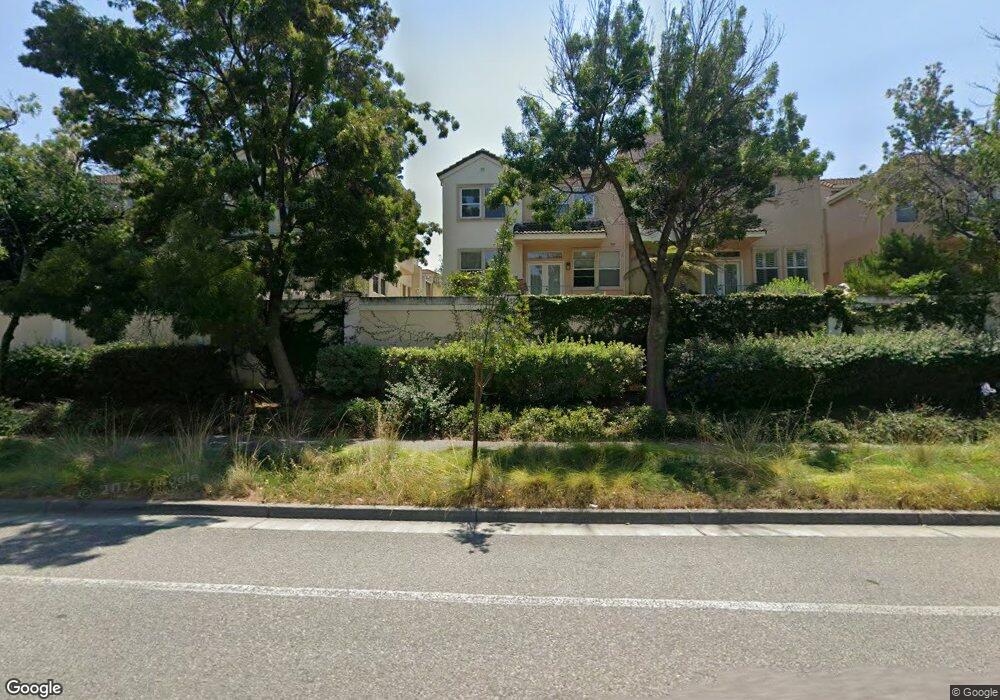
20356 Via Volante Cupertino, CA 95014
North Cupertino NeighborhoodEstimated Value: $2,123,697 - $2,412,000
4
Beds
4
Baths
2,344
Sq Ft
$955/Sq Ft
Est. Value
About This Home
This home is located at 20356 Via Volante, Cupertino, CA 95014 and is currently estimated at $2,237,674, approximately $954 per square foot. 20356 Via Volante is a home located in Santa Clara County with nearby schools including L. P. Collins Elementary School, Cupertino Middle School, and Fremont High School.
Ownership History
Date
Name
Owned For
Owner Type
Purchase Details
Closed on
Mar 22, 2002
Sold by
Jow Gregory S and Jow Sofia Tihonova
Bought by
Lai Daniel S
Current Estimated Value
Home Financials for this Owner
Home Financials are based on the most recent Mortgage that was taken out on this home.
Original Mortgage
$250,000
Outstanding Balance
$101,193
Interest Rate
6.62%
Estimated Equity
$2,136,481
Purchase Details
Closed on
May 2, 2000
Sold by
Jow Gregory S
Bought by
Jow Gregory S and Jow Sofia Tihonova
Home Financials for this Owner
Home Financials are based on the most recent Mortgage that was taken out on this home.
Original Mortgage
$600,000
Interest Rate
10.25%
Purchase Details
Closed on
Apr 4, 2000
Sold by
Tihonova Sofia
Bought by
Jow Gregory S
Home Financials for this Owner
Home Financials are based on the most recent Mortgage that was taken out on this home.
Original Mortgage
$600,000
Interest Rate
10.25%
Purchase Details
Closed on
Jul 9, 1996
Sold by
Palmer John David and Palmer Marguerite Annie
Bought by
Cerny Mark J and Roos Jitka M
Home Financials for this Owner
Home Financials are based on the most recent Mortgage that was taken out on this home.
Original Mortgage
$344,000
Interest Rate
8.32%
Create a Home Valuation Report for This Property
The Home Valuation Report is an in-depth analysis detailing your home's value as well as a comparison with similar homes in the area
Home Values in the Area
Average Home Value in this Area
Purchase History
| Date | Buyer | Sale Price | Title Company |
|---|---|---|---|
| Lai Daniel S | $750,000 | Chicago Title Co | |
| Jow Gregory S | -- | Chicago Title Co | |
| Jow Gregory S | -- | Chicago Title Co | |
| Jow Gregory S | $800,000 | Chicago Title Co | |
| Cerny Mark J | $430,000 | Santa Clara Land Title Co |
Source: Public Records
Mortgage History
| Date | Status | Borrower | Loan Amount |
|---|---|---|---|
| Open | Lai Daniel S | $250,000 | |
| Previous Owner | Jow Gregory S | $600,000 | |
| Previous Owner | Cerny Mark J | $344,000 |
Source: Public Records
Tax History Compared to Growth
Tax History
| Year | Tax Paid | Tax Assessment Tax Assessment Total Assessment is a certain percentage of the fair market value that is determined by local assessors to be the total taxable value of land and additions on the property. | Land | Improvement |
|---|---|---|---|---|
| 2025 | $13,477 | $1,107,586 | $553,681 | $553,905 |
| 2024 | $13,477 | $1,085,870 | $542,825 | $543,045 |
| 2023 | $13,345 | $1,064,580 | $532,182 | $532,398 |
| 2022 | $13,299 | $1,043,707 | $521,748 | $521,959 |
| 2021 | $13,150 | $1,023,243 | $511,518 | $511,725 |
| 2020 | $12,982 | $1,012,752 | $506,274 | $506,478 |
| 2019 | $12,654 | $992,896 | $496,348 | $496,548 |
| 2018 | $12,280 | $973,428 | $486,616 | $486,812 |
| 2017 | $12,187 | $954,342 | $477,075 | $477,267 |
| 2016 | $11,790 | $935,630 | $467,721 | $467,909 |
| 2015 | $11,695 | $921,577 | $460,696 | $460,881 |
| 2014 | $11,389 | $903,525 | $451,672 | $451,853 |
Source: Public Records
Map
Nearby Homes
- 20245 Northglen Square
- 20676 Celeste Cir Unit 71
- 20666 Celeste Cir Unit 59
- 1668 Goldfinch Way
- 125 Connemara Way Unit 3
- 125 Connemara Way Unit 98
- 1479 Blackhawk Ct
- 20730 Dunbar Dr
- 1467 Dove Ln
- 1579 Heron Ave
- 532 Cashmere Ct
- 10240 Randy Ln
- 10631 Mine Ct
- 861 Flin Way
- 1567 Magpie Ln
- 1626 S Wolfe Rd
- 21035 Lauretta Dr
- 1335 Bobolink Cir
- 1308 Yarmouth Terrace
- 1547 Klamath Dr
- 20366 Via Volante
- 20376 Via Volante
- 20346 Via Volante
- 20386 Via Volante
- 20336 Via Volante
- 20396 Via Volante
- 20375 Via Volante
- 20365 Via Volante
- 20385 Via Volante
- 20406 Via Volante
- 20355 Via Volante
- 20326 Via Volante
- 20395 Via Volante
- 20345 Via Volante
- 20416 Via Volante
- 20385 Via Napoli
- 20335 Via Volante
- 20405 Via Volante
- 20373 Via Napoli
- 20397 Via Napoli