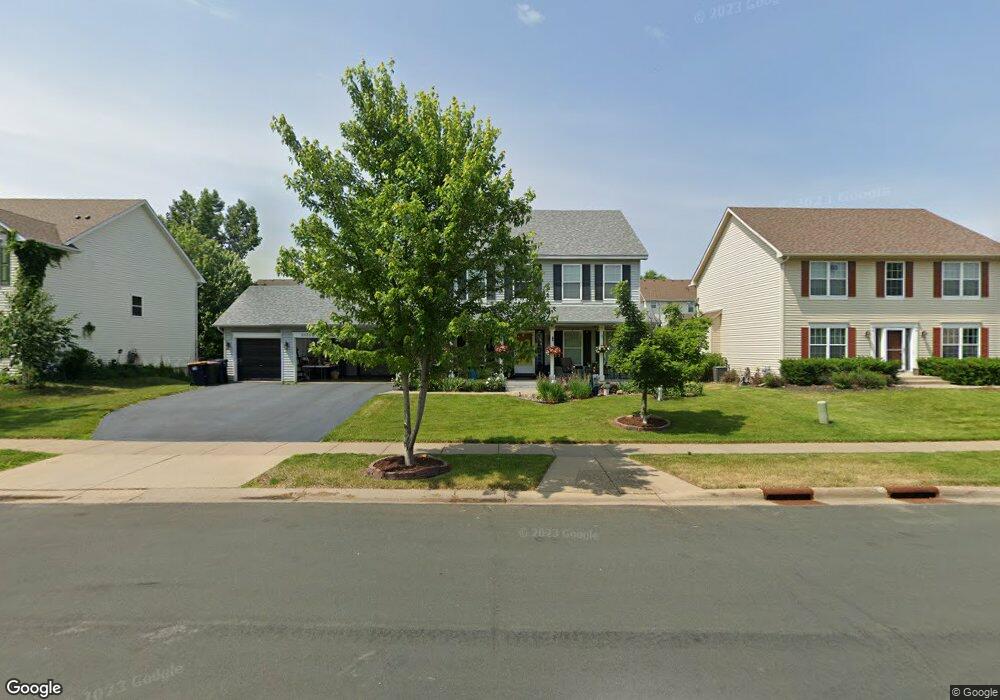
20357 Enright Way Farmington, MN 55024
Estimated Value: $453,520 - $506,000
4
Beds
3
Baths
2,144
Sq Ft
$227/Sq Ft
Est. Value
About This Home
This home is located at 20357 Enright Way, Farmington, MN 55024 and is currently estimated at $485,630, approximately $226 per square foot. 20357 Enright Way is a home located in Dakota County with nearby schools including Riverview Elementary School, Levi P. Dodge Middle School, and Farmington High School.
Ownership History
Date
Name
Owned For
Owner Type
Purchase Details
Closed on
Sep 11, 2017
Sold by
Commers Steven E and Bilski John
Bought by
Lutjen Dagan and Lutjen Irene
Current Estimated Value
Home Financials for this Owner
Home Financials are based on the most recent Mortgage that was taken out on this home.
Original Mortgage
$279,315
Outstanding Balance
$233,060
Interest Rate
3.87%
Mortgage Type
FHA
Estimated Equity
$252,570
Purchase Details
Closed on
Apr 28, 2009
Sold by
Bilski John R and Bilski Twyla J
Bought by
Ferm Debra K and Ferm Steven L
Home Financials for this Owner
Home Financials are based on the most recent Mortgage that was taken out on this home.
Original Mortgage
$297,000
Interest Rate
7%
Mortgage Type
Land Contract Argmt. Of Sale
Purchase Details
Closed on
Sep 29, 2006
Sold by
Toombs Mark E and Toombs Melissa J
Bought by
Bilski John R
Purchase Details
Closed on
Aug 15, 2003
Sold by
D R Horton Inc Mn
Bought by
Toombs Mark E and Toombs Melissa J
Create a Home Valuation Report for This Property
The Home Valuation Report is an in-depth analysis detailing your home's value as well as a comparison with similar homes in the area
Home Values in the Area
Average Home Value in this Area
Purchase History
| Date | Buyer | Sale Price | Title Company |
|---|---|---|---|
| Lutjen Dagan | $320,000 | Ancona Title & Escrow | |
| Ferm Debra K | $302,000 | -- | |
| Bilski John R | $355,000 | -- | |
| Toombs Mark E | $310,747 | -- |
Source: Public Records
Mortgage History
| Date | Status | Borrower | Loan Amount |
|---|---|---|---|
| Open | Lutjen Dagan | $279,315 | |
| Previous Owner | Ferm Debra K | $297,000 |
Source: Public Records
Tax History Compared to Growth
Tax History
| Year | Tax Paid | Tax Assessment Tax Assessment Total Assessment is a certain percentage of the fair market value that is determined by local assessors to be the total taxable value of land and additions on the property. | Land | Improvement |
|---|---|---|---|---|
| 2024 | $4,922 | $397,300 | $108,200 | $289,100 |
| 2023 | $4,922 | $404,900 | $108,400 | $296,500 |
| 2022 | $4,410 | $390,200 | $108,200 | $282,000 |
| 2021 | $4,470 | $316,600 | $94,000 | $222,600 |
| 2020 | $4,344 | $318,100 | $89,500 | $228,600 |
| 2019 | $4,295 | $298,700 | $85,200 | $213,500 |
| 2018 | $4,175 | $290,300 | $81,200 | $209,100 |
| 2017 | $4,185 | $274,900 | $77,300 | $197,600 |
| 2016 | $4,172 | $268,100 | $73,600 | $194,500 |
| 2015 | $3,849 | $246,378 | $67,323 | $179,055 |
| 2014 | -- | $239,838 | $62,460 | $177,378 |
| 2013 | -- | $217,384 | $55,370 | $162,014 |
Source: Public Records
Map
Nearby Homes
- 20514 Erin Ct Unit 15
- 5305 206th St W Unit 133
- 5215 203rd St W
- 5690 200th St W Unit 202
- 19848 Goldfinch Dr Unit 83
- 20170 Dunbar Ave
- 19956 Evensong Ave
- 19927 Akin Rd
- 6586 208th St W
- 6574 208th St W
- 19741 Falcon Path
- 5921 200th St W
- 19622 Escalade Way Unit 1007
- 19627 Meadowlark Way Unit 133
- 19600 Estes Path
- 5509 Oriole Dr Unit 10
- 19871 Dover Dr
- 4797 218th St W
- 19353 Eureka Ct
- 19320 Ellington Trail
- 20365 Enright Way
- 20349 Enright Way
- 20356 Erickson Path
- 20350 Erickson Path
- 20362 Erickson Path
- 20369 Enright Way
- 20341 Enright Way
- 20348 Enright Way
- 20344 Erickson Path
- 20374 Erickson Path
- 20360 Enright Way
- 20340 Enright Way
- 20375 Enright Way
- 20333 Enright Way
- 20364 Enright Way
- 20338 Erickson Path
- 20380 Erickson Path
- 20332 Enright Way
- 20370 Enright Way
- 20355 Erickson Path