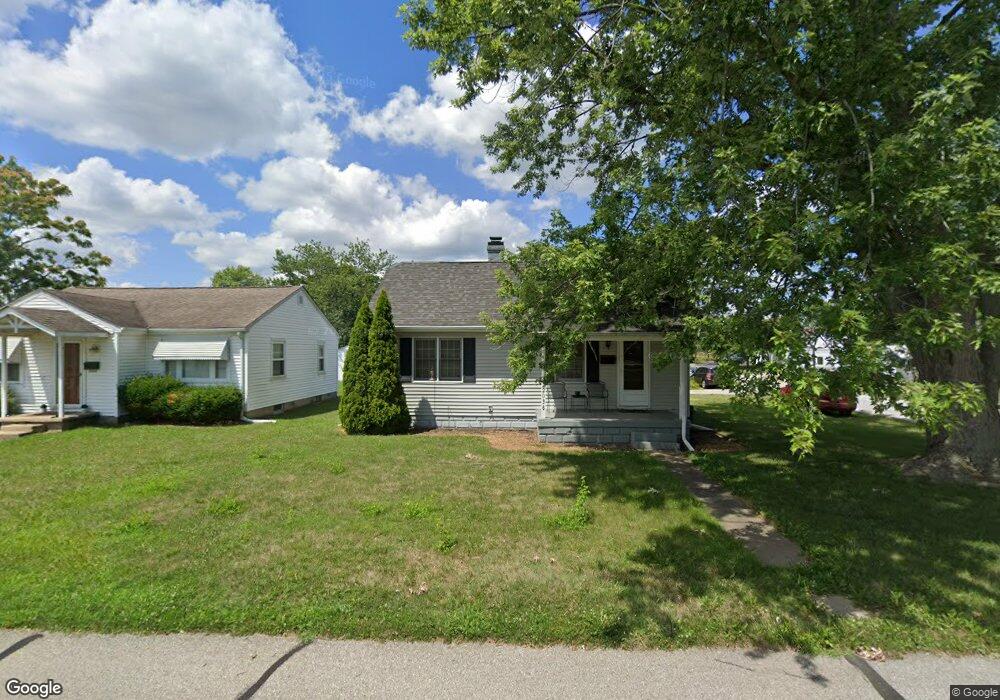
2036 Elm St Columbus, IN 47201
Estimated Value: $130,000 - $158,346
1
Bed
1
Bath
660
Sq Ft
$224/Sq Ft
Est. Value
About This Home
This home is located at 2036 Elm St, Columbus, IN 47201 and is currently estimated at $147,587, approximately $223 per square foot. 2036 Elm St is a home located in Bartholomew County with nearby schools including Lillian Schmitt Elementary School, Northside Middle School, and Columbus North High School.
Ownership History
Date
Name
Owned For
Owner Type
Purchase Details
Closed on
Jul 2, 2019
Sold by
Burns Charles and Myers Matthew A
Bought by
Ditech Financial Llc
Current Estimated Value
Purchase Details
Closed on
Dec 8, 2017
Sold by
Burns Charles
Bought by
Burns Charles
Purchase Details
Closed on
Dec 28, 2004
Sold by
Brockman Mark
Bought by
Smith Gerald L and Smith Judy
Purchase Details
Closed on
Jan 26, 2004
Sold by
Harlow Philip A and Harlow Zandra K
Bought by
Brockman Mark
Create a Home Valuation Report for This Property
The Home Valuation Report is an in-depth analysis detailing your home's value as well as a comparison with similar homes in the area
Home Values in the Area
Average Home Value in this Area
Purchase History
| Date | Buyer | Sale Price | Title Company |
|---|---|---|---|
| Ditech Financial Llc | $60,200 | -- | |
| Burns Charles | -- | None Available | |
| Smith Gerald L | -- | Progressive Land Title | |
| Brockman Mark | $73,500 | -- |
Source: Public Records
Tax History Compared to Growth
Tax History
| Year | Tax Paid | Tax Assessment Tax Assessment Total Assessment is a certain percentage of the fair market value that is determined by local assessors to be the total taxable value of land and additions on the property. | Land | Improvement |
|---|---|---|---|---|
| 2024 | $1,743 | $77,500 | $20,800 | $56,700 |
| 2023 | $1,235 | $53,900 | $14,800 | $39,100 |
| 2022 | $1,231 | $53,900 | $14,900 | $39,000 |
| 2021 | $1,245 | $53,900 | $9,400 | $44,500 |
| 2020 | $1,246 | $94,900 | $18,200 | $76,700 |
| 2019 | $822 | $90,300 | $18,200 | $72,100 |
| 2018 | $781 | $88,200 | $18,200 | $70,000 |
| 2017 | $592 | $84,400 | $18,200 | $66,200 |
| 2016 | $580 | $84,500 | $18,200 | $66,300 |
| 2014 | $605 | $85,000 | $18,200 | $66,800 |
Source: Public Records
Map
Nearby Homes