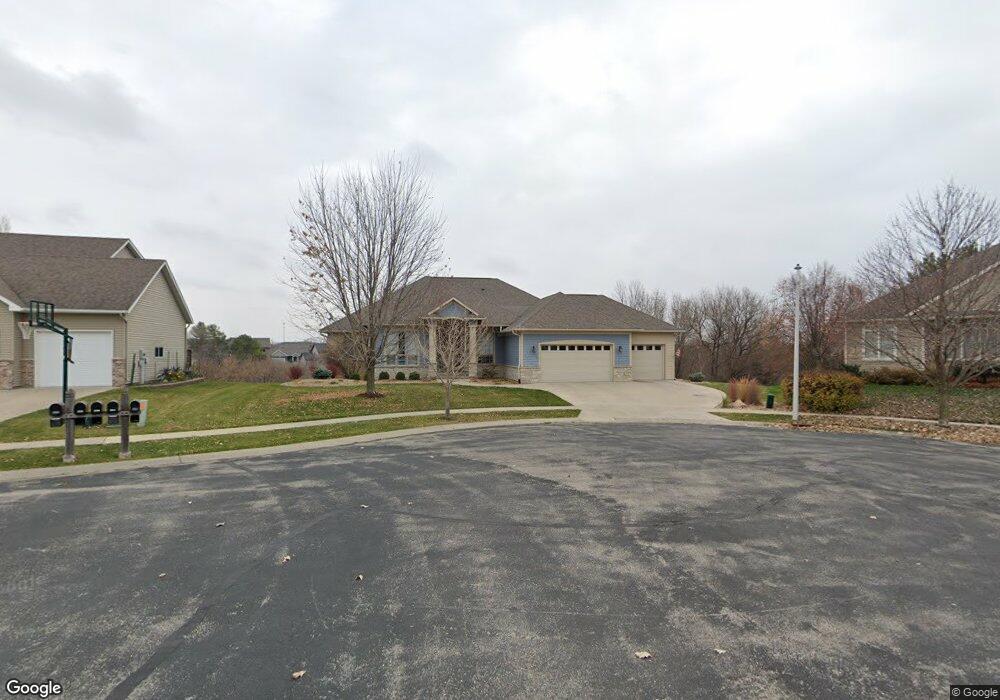
2036 Galway Ln NE Rochester, MN 55906
Estimated Value: $750,000 - $856,000
4
Beds
4
Baths
3,980
Sq Ft
$205/Sq Ft
Est. Value
About This Home
This home is located at 2036 Galway Ln NE, Rochester, MN 55906 and is currently estimated at $815,172, approximately $204 per square foot. 2036 Galway Ln NE is a home located in Olmsted County with nearby schools including Jefferson Elementary School, Kellogg Middle School, and Century Senior High School.
Ownership History
Date
Name
Owned For
Owner Type
Purchase Details
Closed on
Jun 28, 2017
Sold by
Jenkins Donald and Jenkins Elaine
Bought by
Kopp Sandra L
Current Estimated Value
Home Financials for this Owner
Home Financials are based on the most recent Mortgage that was taken out on this home.
Original Mortgage
$400,000
Outstanding Balance
$212,126
Interest Rate
4.02%
Mortgage Type
New Conventional
Estimated Equity
$603,046
Purchase Details
Closed on
Jun 22, 2009
Sold by
Otis Construction Services Llc
Bought by
Jenkins Donald and Jenkins Elaine
Home Financials for this Owner
Home Financials are based on the most recent Mortgage that was taken out on this home.
Original Mortgage
$531,950
Interest Rate
5.43%
Mortgage Type
VA
Purchase Details
Closed on
Sep 17, 2008
Sold by
Wright Homes Inc
Bought by
Otis Construction Services Llc
Create a Home Valuation Report for This Property
The Home Valuation Report is an in-depth analysis detailing your home's value as well as a comparison with similar homes in the area
Home Values in the Area
Average Home Value in this Area
Purchase History
| Date | Buyer | Sale Price | Title Company |
|---|---|---|---|
| Kopp Sandra L | $500,000 | Rochester Title & Escrow Co | |
| Jenkins Donald | $559,800 | Edina Title Rochester | |
| Otis Construction Services Llc | $97,500 | Burnet Title |
Source: Public Records
Mortgage History
| Date | Status | Borrower | Loan Amount |
|---|---|---|---|
| Open | Kopp Sandra L | $400,000 | |
| Previous Owner | Jenkins Donald | $531,950 |
Source: Public Records
Tax History Compared to Growth
Tax History
| Year | Tax Paid | Tax Assessment Tax Assessment Total Assessment is a certain percentage of the fair market value that is determined by local assessors to be the total taxable value of land and additions on the property. | Land | Improvement |
|---|---|---|---|---|
| 2024 | $11,364 | $759,800 | $120,000 | $639,800 |
| 2023 | $9,564 | $713,600 | $100,000 | $613,600 |
| 2022 | $8,902 | $692,700 | $100,000 | $592,700 |
| 2021 | $8,462 | $621,100 | $100,000 | $521,100 |
| 2020 | $8,176 | $594,200 | $100,000 | $494,200 |
| 2019 | $7,734 | $557,100 | $100,000 | $457,100 |
| 2018 | $7,911 | $534,000 | $89,900 | $444,100 |
| 2017 | $8,256 | $521,500 | $89,900 | $431,600 |
| 2016 | $7,374 | $554,600 | $89,900 | $464,700 |
| 2015 | $6,942 | $494,300 | $89,900 | $404,400 |
| 2014 | $6,644 | $494,300 | $89,900 | $404,400 |
| 2012 | -- | $491,500 | $89,900 | $401,600 |
Source: Public Records
Map
Nearby Homes
- 1631 Shannon Oaks Blvd NE
- 1547 Shannon Oaks Blvd NE
- 1490 Shannon Oaks Blvd NE
- 1614 Shannon Oaks Blvd NE
- 1658 Shannon Oaks Blvd NE
- 1663 Shannon Oaks Blvd NE
- 1504 Shannon Oaks Blvd NE
- 1680 Shannon Oaks Blvd NE
- 1882 Kerry Dr NE
- 3265 Allison Ln NE
- 3251 Century Ridge Place NE
- 3153 Century Ridge Rd NE
- 3105 Century Ridge Rd NE
- 3108 Bella Terra Ln NE
- 3180 Bella Terra Ln NE
- 3185 Bella Terra Ln NE
- 3120 Bella Terra Ln NE
- 3235 Bella Terra Rd NE
- 3341 Bella Terra Rd NE
- 3338 Bella Terra Rd NE
- 2042 Galway Ln NE
- 2030 Galway Ln NE
- 2048 Galway Ln NE
- 2041 Galway Ln NE
- 2035 Galway Ln NE
- 2054 Galway Ln NE
- 2047 Galway Ln NE
- 2053 Galway Ln NE
- 2060 Galway Ln NE
- 3171 Scanlan Ln NE
- 3183 Scanlan Ln NE
- 3191 Scanlan Ln NE
- 3159 Scanlan Ln NE
- 2059 Galway Ln NE
- 3199 Scanlan Ln NE
- 1993 Kerry Dr NE
- 1979 1979 Kerry Dr NE
- 1979 Kerry Dr NE
- 3147 Scanlan Ln NE
- 2066 Galway Ln NE