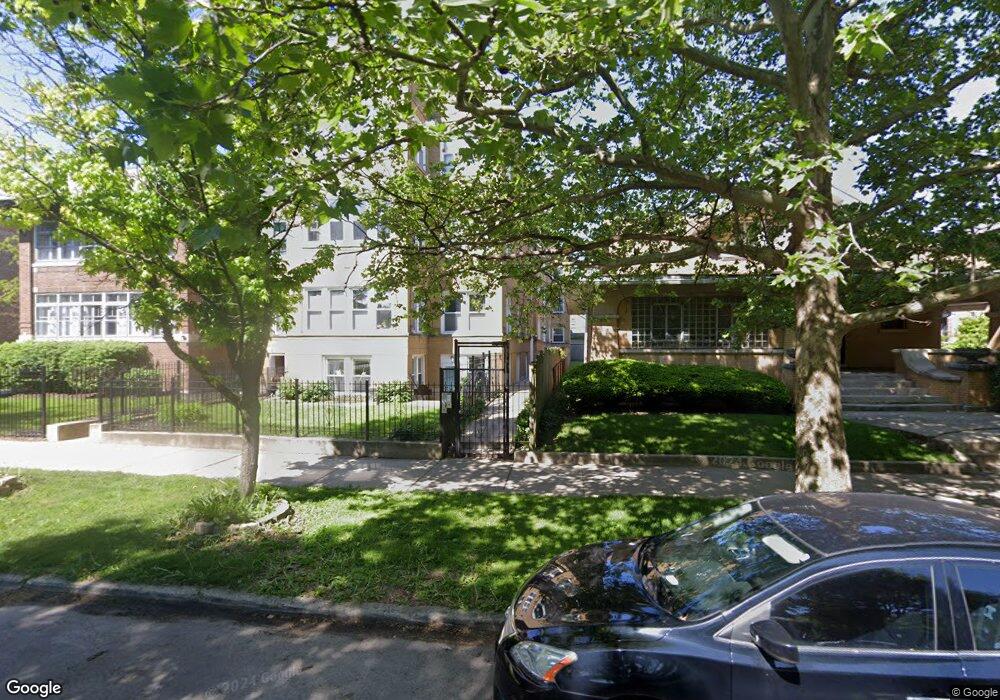
2036 N Humboldt Blvd Unit 1W Chicago, IL 60647
Logan Square NeighborhoodEstimated Value: $413,000 - $513,000
2
Beds
2
Baths
1,400
Sq Ft
$323/Sq Ft
Est. Value
About This Home
This home is located at 2036 N Humboldt Blvd Unit 1W, Chicago, IL 60647 and is currently estimated at $452,292, approximately $323 per square foot. 2036 N Humboldt Blvd Unit 1W is a home located in Cook County with nearby schools including Yates Elementary School, Clemente Community Academy High School, and St. Sylvester School.
Ownership History
Date
Name
Owned For
Owner Type
Purchase Details
Closed on
Dec 13, 2013
Sold by
Mueller Christopher and Dumond Tiffany
Bought by
Mueller Christopher M and Dumond Tiffany
Current Estimated Value
Home Financials for this Owner
Home Financials are based on the most recent Mortgage that was taken out on this home.
Original Mortgage
$157,000
Outstanding Balance
$41,578
Interest Rate
3.62%
Mortgage Type
New Conventional
Estimated Equity
$410,714
Purchase Details
Closed on
Apr 24, 2003
Sold by
Cada Jeffrey J
Bought by
Mueller Christopher
Home Financials for this Owner
Home Financials are based on the most recent Mortgage that was taken out on this home.
Original Mortgage
$193,500
Interest Rate
5.71%
Mortgage Type
Unknown
Create a Home Valuation Report for This Property
The Home Valuation Report is an in-depth analysis detailing your home's value as well as a comparison with similar homes in the area
Home Values in the Area
Average Home Value in this Area
Purchase History
| Date | Buyer | Sale Price | Title Company |
|---|---|---|---|
| Mueller Christopher M | -- | Ravenswood Title Company Llc | |
| Mueller Christopher | $215,000 | Cti | |
| Mueller Christopher | $215,000 | Cti |
Source: Public Records
Mortgage History
| Date | Status | Borrower | Loan Amount |
|---|---|---|---|
| Open | Mueller Christopher M | $157,000 | |
| Previous Owner | Mueller Christopher | $193,500 |
Source: Public Records
Tax History Compared to Growth
Tax History
| Year | Tax Paid | Tax Assessment Tax Assessment Total Assessment is a certain percentage of the fair market value that is determined by local assessors to be the total taxable value of land and additions on the property. | Land | Improvement |
|---|---|---|---|---|
| 2024 | $5,606 | $31,954 | $3,474 | $28,480 |
| 2023 | $5,442 | $29,790 | $1,582 | $28,208 |
| 2022 | $5,442 | $29,790 | $1,582 | $28,208 |
| 2021 | $5,338 | $29,790 | $1,582 | $28,208 |
| 2020 | $5,405 | $27,279 | $1,582 | $25,697 |
| 2019 | $5,392 | $30,170 | $1,582 | $28,588 |
| 2018 | $5,281 | $30,170 | $1,582 | $28,588 |
| 2017 | $4,891 | $26,096 | $1,395 | $24,701 |
| 2016 | $4,727 | $26,096 | $1,395 | $24,701 |
| 2015 | $4,301 | $26,096 | $1,395 | $24,701 |
| 2014 | $3,111 | $19,336 | $1,256 | $18,080 |
| 2013 | $3,038 | $19,336 | $1,256 | $18,080 |
Source: Public Records
Map
Nearby Homes
- 2036 N Humboldt Blvd Unit 1E
- 2026 N Humboldt Blvd
- 2019 N Whipple St Unit 1
- 2032 N Whipple St
- 2014 N Whipple St
- 1949 N Whipple St Unit 1
- 3021 W Armitage Ave Unit 404
- 3060 W Armitage Ave
- 1943 N Whipple St
- 1922 N Humboldt Blvd
- 1918 N Humboldt Blvd
- 1925 N Humboldt Blvd Unit P14
- 1922 N Richmond St
- 2139 N Kedzie Blvd Unit 2
- 2137 N Kedzie Blvd Unit G
- 2040 N Kedzie Ave Unit 2
- 1902 N Albany Ave
- 1925 N Francisco Ave
- 3019 W Lyndale St Unit 1
- 3019 W Lyndale St Unit 2
- 2036 N Humboldt Blvd Unit 2E
- 2036 N Humboldt Blvd Unit 3E
- 2036 N Humboldt Blvd Unit 2036
- 2036 N Humboldt Blvd Unit 2036
- 2034 N Humboldt Blvd Unit 2034
- 2036 N Humboldt Blvd Unit 2036
- 2034 N Humboldt Blvd Unit 2034
- 2034 N Humboldt Blvd Unit 2034
- 2034 N Humboldt Blvd Unit 2034
- 2034 N Humboldt Blvd Unit 2034
- 2034 N Humboldt Blvd Unit 2034
- 2036 N Humboldt Blvd Unit 2036
- 2036 N Humboldt Blvd Unit 2036
- 2036 N Humboldt Blvd Unit 2036
- 2036 N Humboldt Blvd Unit 3W
- 2034 N Humboldt Blvd Unit 2W
- 2034 N Humboldt Blvd Unit 2E
- 2034 N Humboldt Blvd Unit 1E
- 2034 N Humboldt Blvd Unit G
- 2034 N Humboldt Blvd Unit 3W