Collateral Analytics
Collateral Analytics AVMs (Automated Valuation Model) employ a number of statistical approaches combined with neighborhood-specific comparable selection guarantees the most up-to-date and precise valuations.
Not Available
Collateral Analytics does not have data for the current month. Please view the chart for historical values.
ICE
ICE Mortgage Technology
ICE Mortgage Technology’s AVM (Automated Valuation Model) is a state-of-the-art online residential property valuation tool that provides a quick and accurate estimate of the value of almost any home in the U.S.
Not Available
ICE Mortgage Technology does not have data for the current month. Please view the chart for historical values.
First American
First American
First American Data & Analytics’ next-generation AVM combines unrivaled data assets with a blended ensemble of valuation models to produce highly accurate, reliable valuations you can trust.
Not Available
First American does not have data for the current month. Please view the chart for historical values.
Quantarium
Quantarium
Quantarium’s valuation service, repeatedly proven the industry’s most accurate and comprehensive, is supercharged with a self-learning and auto-tuning AI engine that continually becomes smarter and more accurate as it processes daily inputs from the industry’s leading RE data lake.
Not Available
Quantarium does not have data for the current month. Please view the chart for historical values.
Average Value
Not Available
List Price
Sold Price
Create a Home Valuation Report for This Property
The Home Valuation Report is an in-depth analysis detailing your home's value as well as a comparison with similar homes in the area
Home Values in the Area
Source: Public Records
Average Home Value in this Area
Source: Public Records
Tax History
Year
Tax Paid
Tax AssessmentTax Assessment
Total Assessment is a certain percentage of the fair market value that is determined by local assessors to be the total taxable value of land and additions on the property.
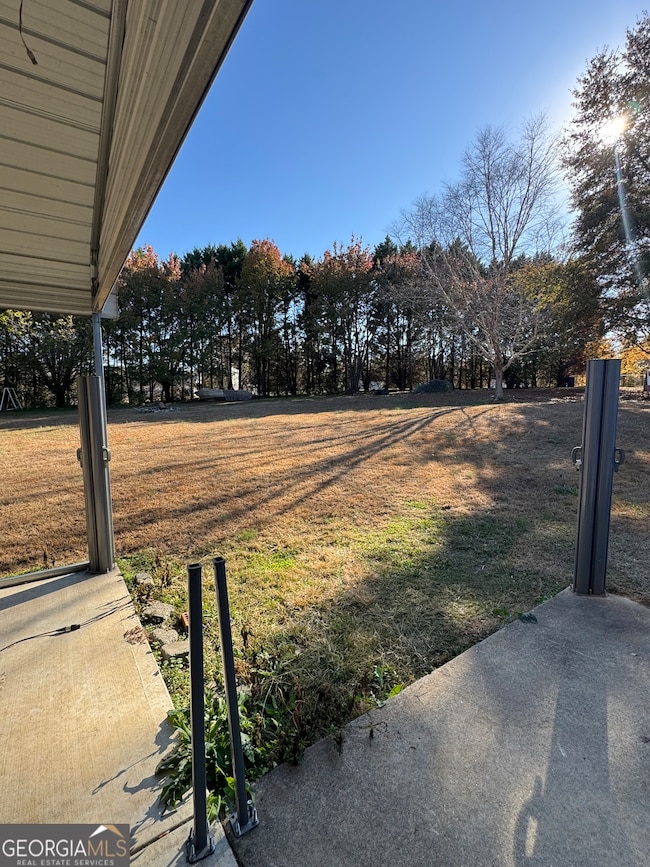
Must see! This spacious well maintained home is on a gorgeous lake lot with privacy. Beautiful creek runs along the property and no one can build next to you! Only lot on Lake Spivey w/ a private cove including a boat slip and Only lot on Lake Spivey w/ a running creek. Also the only lot on Lake Spivey w/ a 2 acre lot next to it, which is unbuildable (designated as "wet lands")...
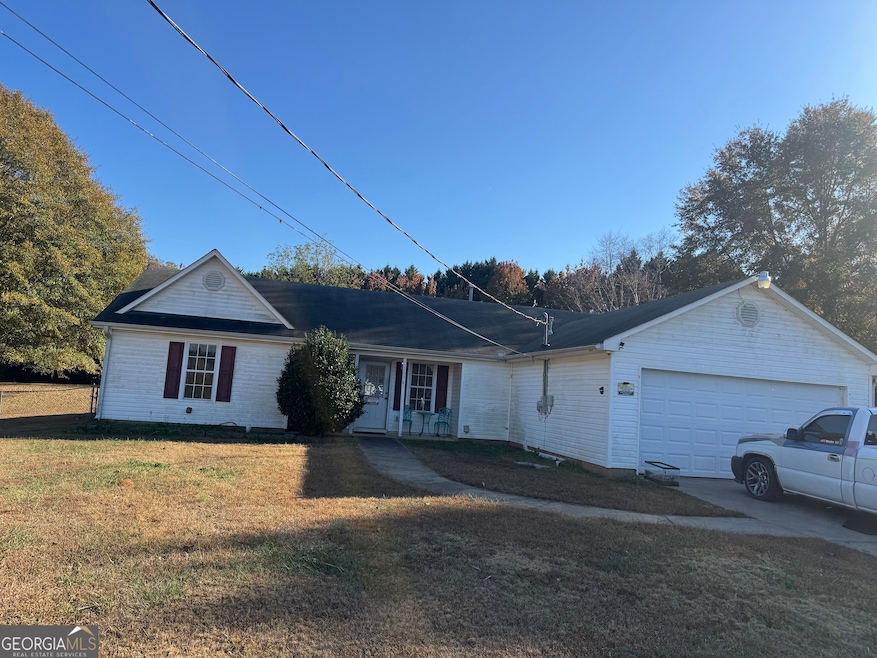
Don't miss this 3 bedroom 1 bath convenient to downtown McDonough! Great for an investor or someone looking for a home that needs a little tlc. Sold As-is.
Great affordable home, in a beautiful well maintained mobile home neighborhood. Quiet cul-de-sac lot. Brand new LVT flooring throughout this spacious 3 bedroom 2 bath home. Could be a great spot for a family or a great investment as it was last rented for $1650.00
Disclaimer: Certain information contained herein is derived from information provided by parties other than Homes.com. All information provided is deemed reliable, but is not guaranteed to be accurate and should be independently verified.
The data relating to real estate for sale on this web site comes in part from the Broker Reciprocity Program of Georgia MLS. Real estate listings held by brokerage firms other than Redfin are marked with the Broker Reciprocity logo and detailed information about them includes the name of the listing brokers. Information deemed reliable but not guaranteed. Copyright 2025 Georgia MLS. All rights reserved.