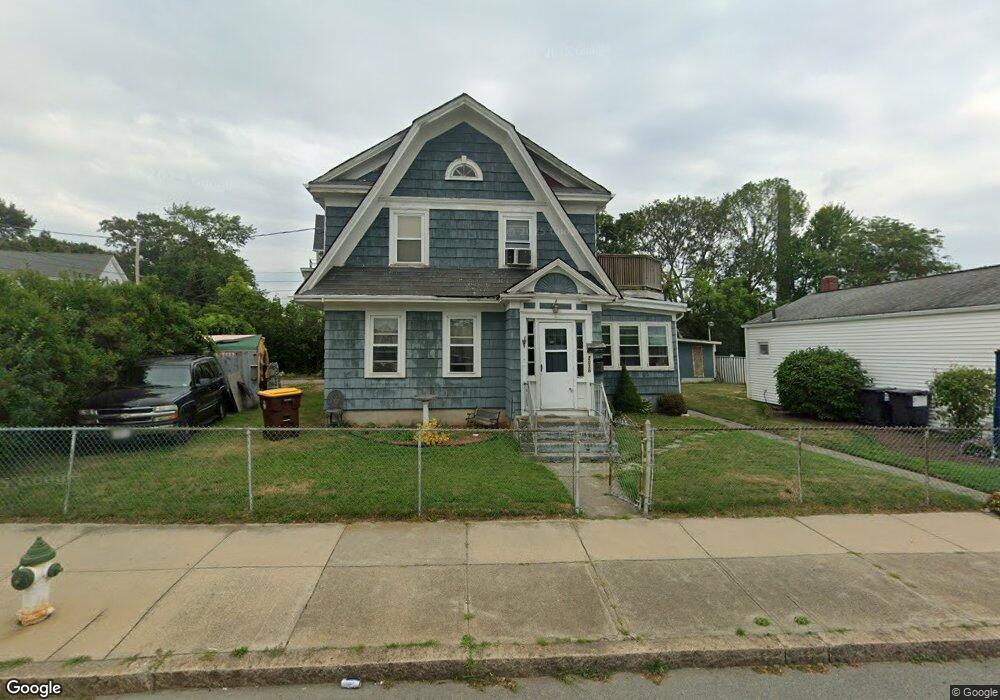
2036 S Main St Unit 2South Fall River, MA 02724
Father Kelly NeighborhoodEstimated Value: $425,000 - $508,000
2
Beds
1
Bath
850
Sq Ft
$535/Sq Ft
Est. Value
About This Home
This home is located at 2036 S Main St Unit 2South, Fall River, MA 02724 and is currently estimated at $455,074, approximately $535 per square foot. 2036 S Main St Unit 2South is a home located in Bristol County with nearby schools including Carlton M. Viveiros Elementary School, Matthew J. Kuss Middle School, and B M C Durfee High School.
Ownership History
Date
Name
Owned For
Owner Type
Purchase Details
Closed on
Jan 22, 2015
Sold by
Blan Mark and Scolaro Elaine
Bought by
M & E Properties Llc
Current Estimated Value
Home Financials for this Owner
Home Financials are based on the most recent Mortgage that was taken out on this home.
Original Mortgage
$42,000
Outstanding Balance
$32,032
Interest Rate
3.96%
Mortgage Type
New Conventional
Estimated Equity
$423,042
Purchase Details
Closed on
Mar 12, 2014
Sold by
Bishop Michael J
Bought by
Fhlmc
Create a Home Valuation Report for This Property
The Home Valuation Report is an in-depth analysis detailing your home's value as well as a comparison with similar homes in the area
Home Values in the Area
Average Home Value in this Area
Purchase History
| Date | Buyer | Sale Price | Title Company |
|---|---|---|---|
| M & E Properties Llc | -- | -- | |
| Fhlmc | $207,805 | -- |
Source: Public Records
Mortgage History
| Date | Status | Borrower | Loan Amount |
|---|---|---|---|
| Open | M & E Properties Llc | $42,000 |
Source: Public Records
Tax History
| Year | Tax Paid | Tax Assessment Tax Assessment Total Assessment is a certain percentage of the fair market value that is determined by local assessors to be the total taxable value of land and additions on the property. | Land | Improvement |
|---|---|---|---|---|
| 2025 | $3,930 | $343,200 | $109,200 | $234,000 |
| 2024 | $3,699 | $321,900 | $105,100 | $216,800 |
| 2023 | $3,454 | $281,500 | $86,900 | $194,600 |
| 2022 | $3,232 | $256,100 | $82,700 | $173,400 |
| 2021 | $3,019 | $218,300 | $78,700 | $139,600 |
| 2020 | $3,050 | $211,100 | $77,600 | $133,500 |
| 2019 | $2,652 | $181,900 | $74,700 | $107,200 |
| 2018 | $2,649 | $181,200 | $80,900 | $100,300 |
| 2017 | $2,411 | $172,200 | $77,100 | $95,100 |
| 2016 | $2,384 | $174,900 | $82,000 | $92,900 |
| 2015 | $2,348 | $179,500 | $82,000 | $97,500 |
| 2014 | $2,330 | $185,200 | $79,600 | $105,600 |
Source: Public Records
Map
Nearby Homes
- 15 Higgins St
- 57 Larouche St
- 2229 S Main St
- 1852 S Main St
- 126 Wheeler St
- 1846 S Main St
- 616 Woodman St
- 609 King Philip St
- 464 Birch St
- 234 Kilburn St
- 917 Dwelly St
- 30 Broad St
- 579 Summit St Unit 3
- 579 Summit St Unit 2
- 245 Dwelly St
- 20 Wilcox St
- 391 Clarkson St
- 143 Meeson St
- 250 Laurel St
- 24 Valley St
Your Personal Tour Guide
Ask me questions while you tour the home.