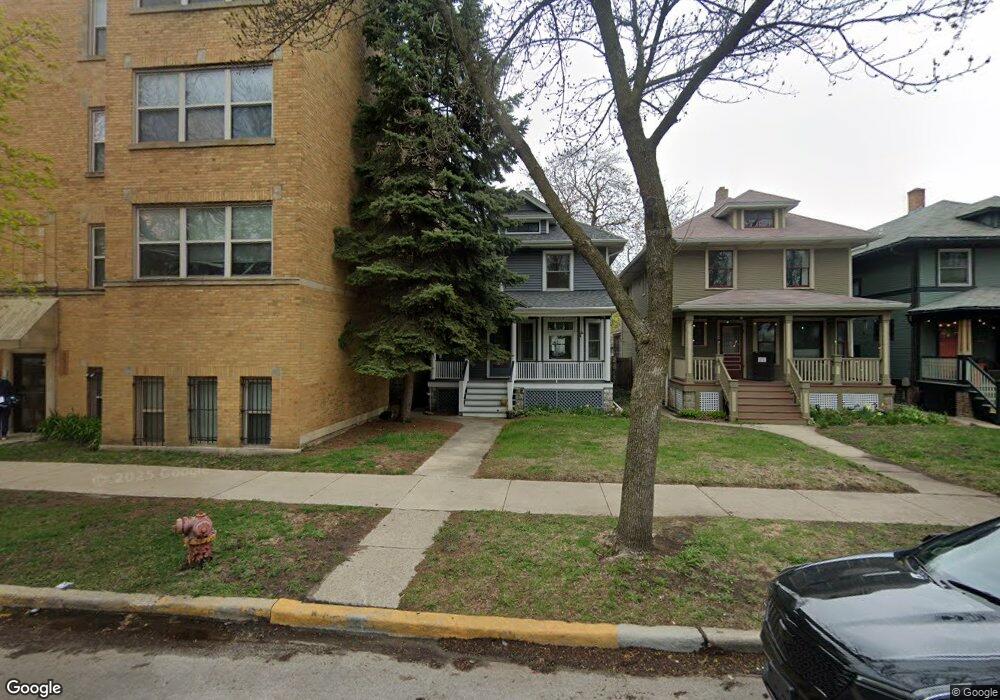
2036 W Touhy Ave Chicago, IL 60645
Rogers Park NeighborhoodEstimated Value: $388,000 - $504,000
3
Beds
1
Bath
1,232
Sq Ft
$360/Sq Ft
Est. Value
About This Home
This home is located at 2036 W Touhy Ave, Chicago, IL 60645 and is currently estimated at $443,529, approximately $360 per square foot. 2036 W Touhy Ave is a home located in Cook County with nearby schools including George Armstrong Elementary School, New Field Elementary School, and Sullivan High School.
Ownership History
Date
Name
Owned For
Owner Type
Purchase Details
Closed on
May 30, 2003
Sold by
Johnson Benjamin R and Johnson Heather L
Bought by
Harbaugh Bradley J and Ganey Julie C
Current Estimated Value
Home Financials for this Owner
Home Financials are based on the most recent Mortgage that was taken out on this home.
Original Mortgage
$202,400
Interest Rate
4.5%
Mortgage Type
Unknown
Purchase Details
Closed on
Apr 17, 2000
Sold by
Hud
Bought by
Smeu Stanel and Smeu Elena
Home Financials for this Owner
Home Financials are based on the most recent Mortgage that was taken out on this home.
Original Mortgage
$105,600
Interest Rate
11.12%
Purchase Details
Closed on
Mar 28, 1996
Sold by
Fletcher Velma L
Bought by
Dale Jessie and Dale Remaide
Home Financials for this Owner
Home Financials are based on the most recent Mortgage that was taken out on this home.
Original Mortgage
$118,850
Interest Rate
7.86%
Mortgage Type
FHA
Create a Home Valuation Report for This Property
The Home Valuation Report is an in-depth analysis detailing your home's value as well as a comparison with similar homes in the area
Home Values in the Area
Average Home Value in this Area
Purchase History
| Date | Buyer | Sale Price | Title Company |
|---|---|---|---|
| Harbaugh Bradley J | $253,000 | Multiple | |
| Smeu Stanel | -- | Stewart Title | |
| Dale Jessie | $119,000 | Attorneys Natl Title Network |
Source: Public Records
Mortgage History
| Date | Status | Borrower | Loan Amount |
|---|---|---|---|
| Previous Owner | Harbaugh Bradley J | $202,400 | |
| Previous Owner | Smeu Stanel | $105,600 | |
| Previous Owner | Dale Jessie | $118,850 | |
| Closed | Smeu Stanel | $26,400 |
Source: Public Records
Tax History Compared to Growth
Tax History
| Year | Tax Paid | Tax Assessment Tax Assessment Total Assessment is a certain percentage of the fair market value that is determined by local assessors to be the total taxable value of land and additions on the property. | Land | Improvement |
|---|---|---|---|---|
| 2024 | $5,208 | $38,001 | $8,843 | $29,158 |
| 2023 | $5,056 | $28,000 | $7,074 | $20,926 |
| 2022 | $5,056 | $28,000 | $7,074 | $20,926 |
| 2021 | $4,961 | $28,000 | $7,074 | $20,926 |
| 2020 | $5,228 | $26,572 | $5,698 | $20,874 |
| 2019 | $5,554 | $31,074 | $5,698 | $25,376 |
| 2018 | $5,460 | $31,074 | $5,698 | $25,376 |
| 2017 | $5,441 | $28,652 | $5,109 | $23,543 |
| 2016 | $5,239 | $28,652 | $5,109 | $23,543 |
| 2015 | $4,770 | $28,652 | $5,109 | $23,543 |
| 2014 | $4,330 | $25,906 | $4,716 | $21,190 |
| 2013 | $4,233 | $25,906 | $4,716 | $21,190 |
Source: Public Records
Map
Nearby Homes
- 7223 N Damen Ave
- 7227 N Damen Ave
- 7207 N Damen Ave Unit 2
- 7228 N Rogers Ave
- 7102 N Damen Ave Unit 3
- 7320 N Rogers Ave Unit 514
- 2044 W Jarvis Ave Unit 3G
- 2038 W Jarvis Ave Unit 20382D
- 2038 W Jarvis Ave Unit 2F
- 2109 W Jarvis Ave Unit 1
- 7074 N Ridge Blvd Unit 1E
- 7070 N Ridge Blvd Unit 1A
- 7234 N Hamilton Ave
- 1810 W Touhy Ave
- 1812 W Estes Ave
- 1842 W Greenleaf Ave
- 7019 N Ridge Blvd Unit 3B
- 7019 N Ridge Blvd Unit 3A
- 2175 W Touhy Ave
- 7344 N Ridge Blvd Unit 5C
- 2032 W Touhy Ave
- 7227 N Rogers Ave Unit G
- 7227 N Rogers Ave Unit G
- 7227 N Rogers Ave Unit B
- 7227 N Rogers Ave
- 7227 N Rogers Ave Unit 3
- 7227 N Rogers Ave Unit 1
- 2030 W Touhy Ave
- 7229 N Rogers Ave Unit 2
- 7229 N Rogers Ave
- 7229 N Rogers Ave Unit 3
- 2038 W Touhy Ave
- 2038 W Touhy Ave Unit 1
- 2046 W Touhy Ave Unit 2
- 2046 W Touhy Ave Unit 1
- 2046 W Touhy Ave Unit 3
- 2028 W Touhy Ave
- 7225 N Rogers Ave Unit 1
- 7225 N Rogers Ave Unit 3
- 7223 N Rogers Ave Unit 1