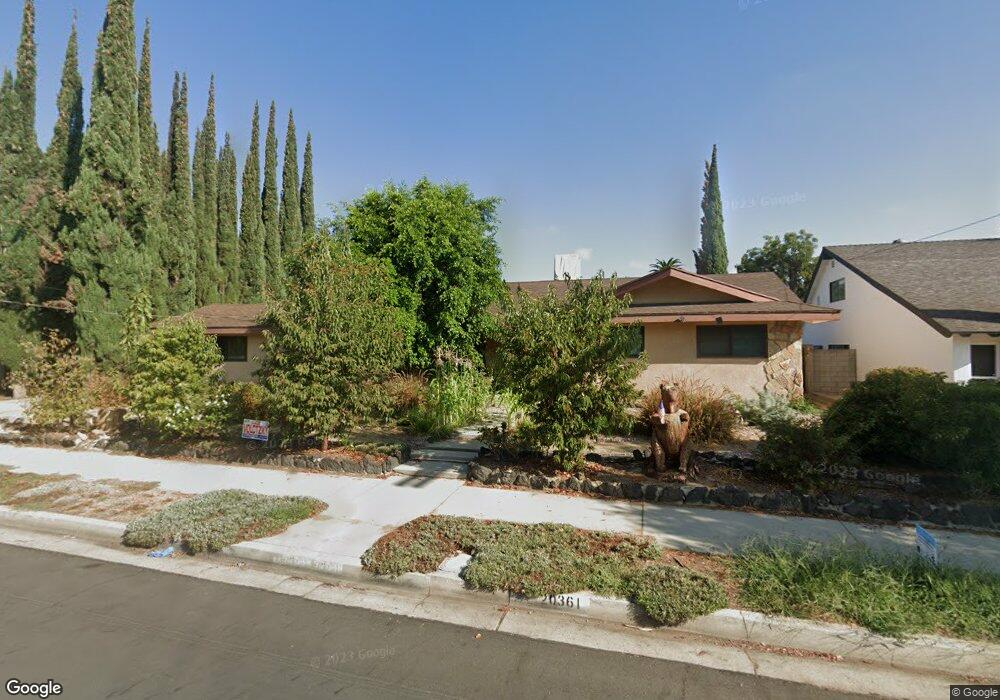
20361 Valerio St Winnetka, CA 91306
Estimated Value: $952,000 - $1,014,299
3
Beds
2
Baths
2,164
Sq Ft
$451/Sq Ft
Est. Value
About This Home
This home is located at 20361 Valerio St, Winnetka, CA 91306 and is currently estimated at $976,575, approximately $451 per square foot. 20361 Valerio St is a home located in Los Angeles County with nearby schools including Sunny Brae Avenue Elementary School, John A. Sutter Middle School, and Northridge Academy High.
Ownership History
Date
Name
Owned For
Owner Type
Purchase Details
Closed on
Jan 28, 2010
Sold by
Arseneault Georges
Bought by
Arseneault Georges T and Reilly Marie C
Current Estimated Value
Home Financials for this Owner
Home Financials are based on the most recent Mortgage that was taken out on this home.
Original Mortgage
$306,750
Outstanding Balance
$203,828
Interest Rate
5.11%
Mortgage Type
New Conventional
Estimated Equity
$772,747
Purchase Details
Closed on
Sep 26, 2001
Sold by
Sabatino Richard and Sabatino Vicki
Bought by
Arseneault Georges
Home Financials for this Owner
Home Financials are based on the most recent Mortgage that was taken out on this home.
Original Mortgage
$260,000
Interest Rate
6.84%
Purchase Details
Closed on
May 8, 1995
Sold by
Barbagiovanni Kathleen and Thayes Delores
Bought by
Sabatino Richard and Sabatino Vicki
Home Financials for this Owner
Home Financials are based on the most recent Mortgage that was taken out on this home.
Original Mortgage
$169,000
Interest Rate
8.47%
Create a Home Valuation Report for This Property
The Home Valuation Report is an in-depth analysis detailing your home's value as well as a comparison with similar homes in the area
Home Values in the Area
Average Home Value in this Area
Purchase History
| Date | Buyer | Sale Price | Title Company |
|---|---|---|---|
| Arseneault Georges T | -- | Lsi Local Solutions | |
| Arseneault Georges | $325,000 | American Title Co | |
| Sabatino Richard | $188,000 | -- |
Source: Public Records
Mortgage History
| Date | Status | Borrower | Loan Amount |
|---|---|---|---|
| Open | Arseneault Georges T | $306,750 | |
| Closed | Arseneault Georges | $260,000 | |
| Previous Owner | Sabatino Richard | $169,000 |
Source: Public Records
Tax History Compared to Growth
Tax History
| Year | Tax Paid | Tax Assessment Tax Assessment Total Assessment is a certain percentage of the fair market value that is determined by local assessors to be the total taxable value of land and additions on the property. | Land | Improvement |
|---|---|---|---|---|
| 2025 | $6,080 | $480,097 | $277,719 | $202,378 |
| 2024 | $6,080 | $470,684 | $272,274 | $198,410 |
| 2023 | $5,968 | $461,456 | $266,936 | $194,520 |
| 2022 | $5,702 | $452,408 | $261,702 | $190,706 |
| 2021 | $5,625 | $443,538 | $256,571 | $186,967 |
| 2019 | $5,462 | $430,384 | $248,962 | $181,422 |
| 2018 | $5,253 | $421,946 | $244,081 | $177,865 |
| 2016 | $5,004 | $405,563 | $234,604 | $170,959 |
| 2015 | $4,932 | $399,473 | $231,081 | $168,392 |
| 2014 | $4,960 | $391,649 | $226,555 | $165,094 |
Source: Public Records
Map
Nearby Homes
- 7463 Mason Ave
- 20258 Cohasset St Unit 4
- 20214 Cohasset St
- 20158 Cohasset St Unit 10
- 7614 Mason Ave
- 20352 Keswick St
- 7640 Oso Ave Unit 316
- 7640 Oso Ave Unit 217
- 20122 Cohasset St
- 20551 Saticoy St
- 20134 Leadwell St Unit 374
- 20134 Leadwell St Unit 306
- 20134 Leadwell St Unit 156
- 20134 Leadwell St Unit 217
- 20134 Leadwell St Unit 133
- 20110 Cohasset St
- 20224 Sherman Way Unit 26
- 20253 Keswick St Unit 103
- 20253 Keswick St Unit 233
- 20253 Keswick St Unit 326
- 20365 Valerio St
- 20349 Valerio St
- 7413 Casaba Ave
- 7410 Delco Ave
- 7412 Delco Ave
- 7406 Delco Ave
- 7407 Casaba Ave
- 7415 Casaba Ave
- 20356 Runnymede St
- 7400 Delco Ave
- 20354 Runnymede St
- 7401 Casaba Ave
- 7414 Delco Ave
- 7360 Fullbright Ave
- 7419 Casaba Ave
- 7416 Delco Ave
- 7341 Casaba Ave
- 7354 Fullbright Ave
- 7361 Fullbright Ave
- 20400 Runnymede St