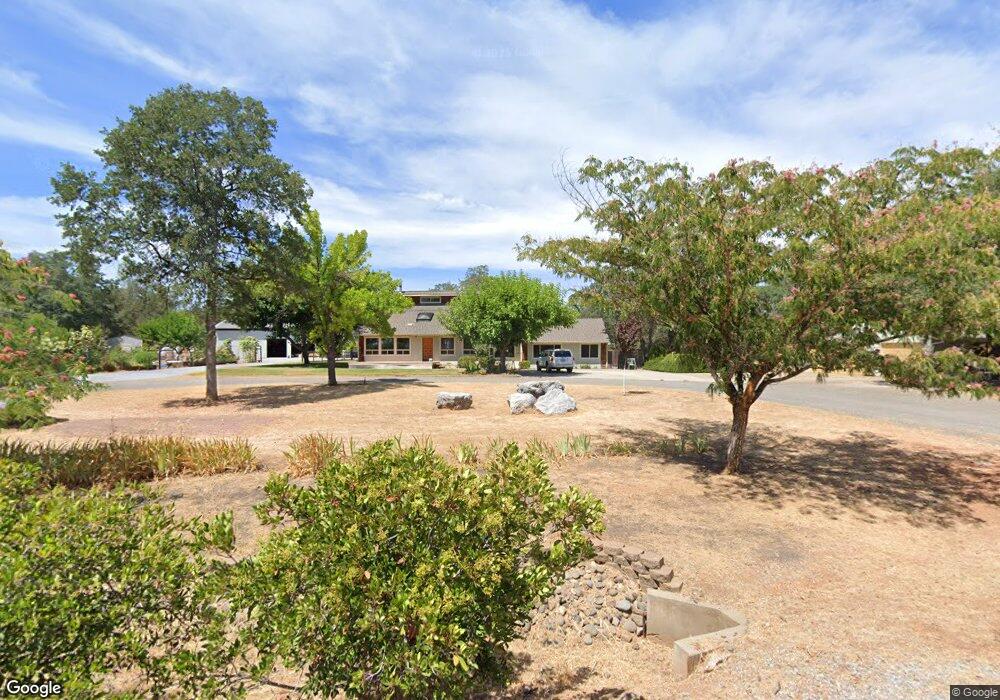
20368 Theda Ct Redding, CA 96003
Estimated Value: $467,000 - $545,000
4
Beds
3
Baths
2,400
Sq Ft
$207/Sq Ft
Est. Value
About This Home
This home is located at 20368 Theda Ct, Redding, CA 96003 and is currently estimated at $497,764, approximately $207 per square foot. 20368 Theda Ct is a home located in Shasta County.
Ownership History
Date
Name
Owned For
Owner Type
Purchase Details
Closed on
Dec 6, 2016
Sold by
Logan Wayne K and Logan Sharon A
Bought by
Logan Wayne K and Logan Sharon A
Current Estimated Value
Create a Home Valuation Report for This Property
The Home Valuation Report is an in-depth analysis detailing your home's value as well as a comparison with similar homes in the area
Purchase History
| Date | Buyer | Sale Price | Title Company |
|---|---|---|---|
| Logan Wayne K | -- | None Available |
Source: Public Records
Tax History
| Year | Tax Paid | Tax Assessment Tax Assessment Total Assessment is a certain percentage of the fair market value that is determined by local assessors to be the total taxable value of land and additions on the property. | Land | Improvement |
|---|---|---|---|---|
| 2025 | $4,666 | $417,779 | $77,246 | $340,533 |
| 2024 | $4,577 | $409,588 | $75,732 | $333,856 |
| 2023 | $4,577 | $401,558 | $74,248 | $327,310 |
| 2022 | $3,259 | $284,086 | $72,793 | $211,293 |
| 2021 | $3,244 | $278,516 | $71,366 | $207,150 |
| 2020 | $3,211 | $275,661 | $70,635 | $205,026 |
| 2019 | $3,114 | $270,256 | $69,250 | $201,006 |
| 2018 | $3,132 | $264,958 | $67,893 | $197,065 |
| 2017 | $3,080 | $259,763 | $66,562 | $193,201 |
| 2016 | $2,950 | $254,670 | $65,257 | $189,413 |
| 2015 | $2,904 | $250,845 | $64,277 | $186,568 |
| 2014 | $2,911 | $245,932 | $63,018 | $182,914 |
Source: Public Records
Map
Nearby Homes
- 0 Spring Lake St
- 0 Bear Mountain Rd Unit 26-985
- 12832 Los Osos St
- 20114 Vernita Dr
- NSA Bernard Way
- 20700 Bernard Way
- 19767 Paso Robles Ave
- 0 Manzanillo Way Unit 25-2218
- 0 Manzanillo Way Unit 22-4418
- 20105 Portero Dr
- 13315 Tierra Heights Rd
- 19988 Paso Robles Ave
- 19902 Little Acres Ln
- 12600 Autumn Oaks Ln
- 12851 Old Oregon Trail
- 13693 Kitty Hawk Ln
- 12910 Old Oregon Trail
- 13335 Alicia Pkwy
- 19626 San Vincente Dr
- 13231 Alicia Pkwy
- 20346 Theda Ct
- 13012 Fernie Way
- 20345 Theda Ct
- 20345 Theda 1weup7mr20t3
- 20348 Lords Ln
- 13033 Fernie Way
- 13027 Spring Lake St
- 13125 Fernie Way Unit 1
- 13125 Fernie Way
- 20401 Helena Oaks Ln
- 13031 Spring Lake St
- 13047 Spring Lake St Unit 1
- 13047 Spring Lake St
- 13061 Spring Lake St
- 13018 Spring Lake St
- 13095 Spring Lake St
- 13133 Fernie Way
- 13087 Spring Lake St
- 13034 Spring Lake St
- 13140 Fernie Way
Your Personal Tour Guide
Ask me questions while you tour the home.