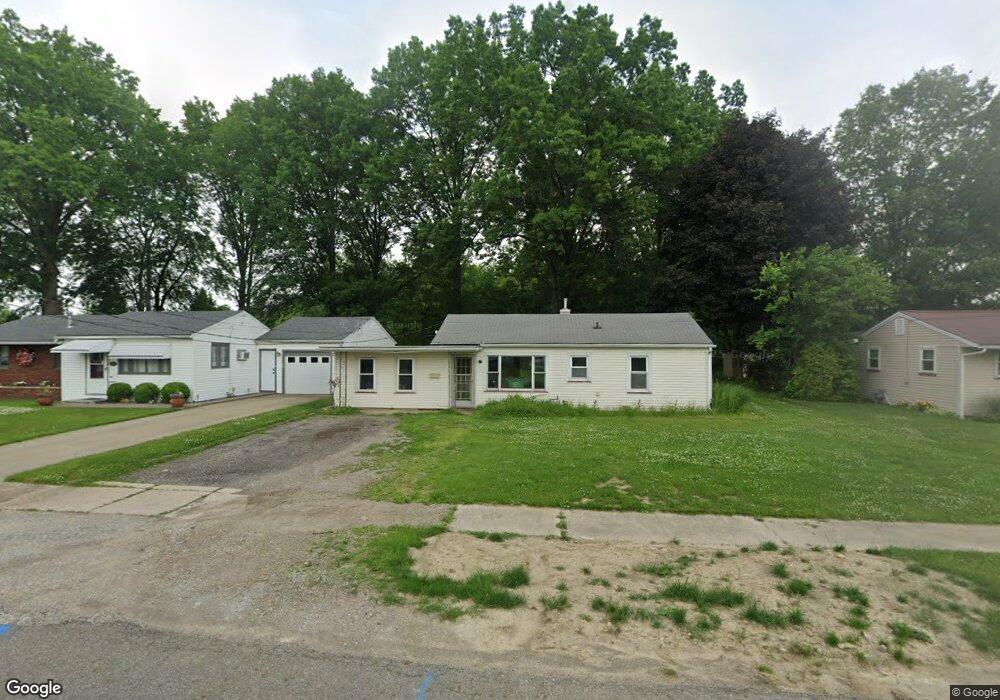
2037 E 31st St Ashtabula, OH 44004
Estimated Value: $39,475 - $117,000
3
Beds
1
Bath
1,000
Sq Ft
$88/Sq Ft
Est. Value
About This Home
This home is located at 2037 E 31st St, Ashtabula, OH 44004 and is currently estimated at $87,619, approximately $87 per square foot. 2037 E 31st St is a home located in Ashtabula County with nearby schools including Ridgeview Elementary School, Kingsville Elementary School, and Wallace H. Braden Junior High School.
Ownership History
Date
Name
Owned For
Owner Type
Purchase Details
Closed on
May 1, 2025
Sold by
Parker Rhonda M and Hudson Trudy
Bought by
Rock Creek Housing Llc
Current Estimated Value
Purchase Details
Closed on
Feb 10, 2015
Sold by
Korinek Libor
Bought by
Parker Rhonda M
Purchase Details
Closed on
Dec 29, 2009
Sold by
Silverleaf Financial 23 Llc
Bought by
Korinek Libor
Purchase Details
Closed on
Sep 4, 2009
Sold by
Starcher Kyra K and Starcher John
Bought by
Silverleaf Financial
Purchase Details
Closed on
Jun 14, 2004
Sold by
Keyers Kyra K and Starcher Kyra K
Bought by
Starcher Kyra K
Home Financials for this Owner
Home Financials are based on the most recent Mortgage that was taken out on this home.
Original Mortgage
$52,000
Interest Rate
6.17%
Mortgage Type
New Conventional
Purchase Details
Closed on
Mar 16, 2000
Sold by
Keyes Raymond H
Bought by
Keyes Kyra K
Create a Home Valuation Report for This Property
The Home Valuation Report is an in-depth analysis detailing your home's value as well as a comparison with similar homes in the area
Home Values in the Area
Average Home Value in this Area
Purchase History
| Date | Buyer | Sale Price | Title Company |
|---|---|---|---|
| Rock Creek Housing Llc | $40,000 | Conway Land Title | |
| Rock Creek Housing Llc | $40,000 | Conway Land Title | |
| Parker Rhonda M | -- | None Available | |
| Korinek Libor | $24,000 | Titleco Title Agency | |
| Silverleaf Financial 23 Llc | -- | Titleco Title Agency | |
| Silverleaf Financial | -- | Titleco Title Agency | |
| Starcher Kyra K | -- | Tower City Title Agency Inc | |
| Keyes Kyra K | $24,500 | -- |
Source: Public Records
Mortgage History
| Date | Status | Borrower | Loan Amount |
|---|---|---|---|
| Previous Owner | Starcher Kyra K | $52,000 |
Source: Public Records
Tax History
| Year | Tax Paid | Tax Assessment Tax Assessment Total Assessment is a certain percentage of the fair market value that is determined by local assessors to be the total taxable value of land and additions on the property. | Land | Improvement |
|---|---|---|---|---|
| 2024 | $1,748 | $19,780 | $4,620 | $15,160 |
| 2023 | $1,501 | $19,780 | $4,620 | $15,160 |
| 2022 | $525 | $14,360 | $3,540 | $10,820 |
| 2021 | $1,209 | $14,360 | $3,540 | $10,820 |
| 2020 | $330 | $14,360 | $3,540 | $10,820 |
| 2019 | $241 | $12,360 | $3,360 | $9,000 |
| 2018 | $233 | $12,360 | $3,360 | $9,000 |
| 2017 | $691 | $12,360 | $3,360 | $9,000 |
| 2016 | $352 | $14,850 | $4,030 | $10,820 |
| 2015 | $2,315 | $14,850 | $4,030 | $10,820 |
| 2014 | $885 | $14,850 | $4,030 | $10,820 |
| 2013 | $752 | $14,600 | $3,610 | $10,990 |
Source: Public Records
Map
Nearby Homes
- 3024 Latimer Ave
- 3003 Blair Ave
- 3001 Blair Ave
- 3038 Eureka Rd
- 3129 Lincoln Dr
- 2124 E 40th St
- 3033 Avon Blvd
- 4016 State Rd
- 3603 Silvieus Dr
- 1331 E 28th St
- 4211 Birchwood Ave
- 4320 Birchwood Ave
- 2130 E 44th St
- 4422 Rodgers Rd
- 0 E 23rd St Unit 5187222
- 4422 State Rd
- 0 Middle Rd
- 4211 Park Ave
- 3835 Lake Ave
- 3829 Lake Ave
Your Personal Tour Guide
Ask me questions while you tour the home.