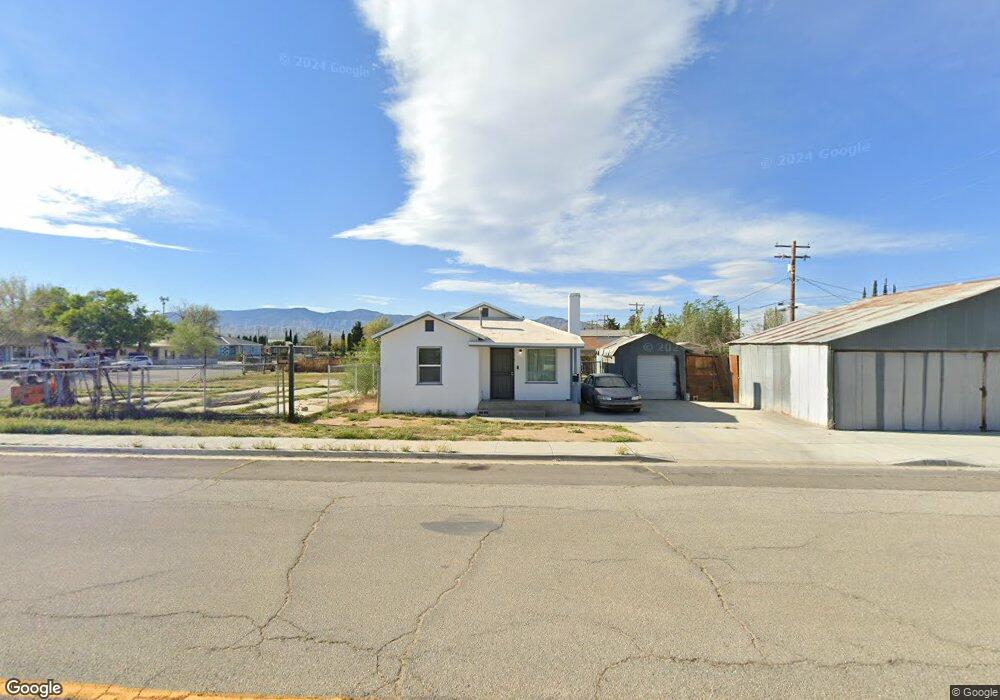
2037 Inyo St Mojave, CA 93501
Estimated Value: $113,304 - $167,000
1
Bed
1
Bath
588
Sq Ft
$226/Sq Ft
Est. Value
About This Home
This home is located at 2037 Inyo St, Mojave, CA 93501 and is currently estimated at $132,826, approximately $225 per square foot. 2037 Inyo St is a home located in Kern County with nearby schools including Mojave Elementary School and Mojave Junior/Senior High School.
Ownership History
Date
Name
Owned For
Owner Type
Purchase Details
Closed on
Aug 15, 2015
Sold by
Morris Charline F and Morris William J
Bought by
Morris William J
Current Estimated Value
Purchase Details
Closed on
Jul 23, 2014
Sold by
Morris Charline F
Bought by
Morris Charline F and Morris William J
Purchase Details
Closed on
Mar 24, 2010
Sold by
Morris Charles W
Bought by
Morris Charles W and Morris Charline F
Create a Home Valuation Report for This Property
The Home Valuation Report is an in-depth analysis detailing your home's value as well as a comparison with similar homes in the area
Home Values in the Area
Average Home Value in this Area
Purchase History
| Date | Buyer | Sale Price | Title Company |
|---|---|---|---|
| Morris William J | -- | None Available | |
| Morris Charline F | -- | None Available | |
| Morris Charles W | -- | None Available |
Source: Public Records
Tax History
| Year | Tax Paid | Tax Assessment Tax Assessment Total Assessment is a certain percentage of the fair market value that is determined by local assessors to be the total taxable value of land and additions on the property. | Land | Improvement |
|---|---|---|---|---|
| 2025 | $375 | $16,761 | $3,812 | $12,949 |
| 2024 | $377 | $16,434 | $3,738 | $12,696 |
| 2023 | $377 | $16,113 | $3,665 | $12,448 |
| 2022 | $360 | $15,798 | $3,594 | $12,204 |
| 2021 | $297 | $15,489 | $3,524 | $11,965 |
| 2020 | $271 | $15,331 | $3,488 | $11,843 |
| 2019 | $271 | $15,331 | $3,488 | $11,843 |
| 2018 | $304 | $14,737 | $3,353 | $11,384 |
| 2017 | $310 | $14,449 | $3,288 | $11,161 |
| 2016 | $295 | $14,167 | $3,224 | $10,943 |
| 2015 | $292 | $13,955 | $3,176 | $10,779 |
| 2014 | $289 | $13,682 | $3,114 | $10,568 |
Source: Public Records
Map
Nearby Homes
- 15820 N St
- 15972 M St
- 15951 M St
- 2000 Shasta St
- 16025 L St
- 2121 Nadeau St Unit Spc C1
- 2121 Nadeau St
- 0 K St Unit 9991945
- 0 K St Unit 9991947
- 15623 M St
- 16043 K St
- 0 Mohawk Ave Unit 25007790
- 0 El Dorado Ave Unit 25008740
- 0 Avenue 9 Unit 18010649
- 230 St. E and South of Sequoia Blvd
- 0 Avenue 9 Unit 18010505
- 0 Avenue 9 Unit SR18241831
- 0 Avenue 9 Unit SR18239432
- 0 Mohawk Ave Unit SR25088842
- 16212 K St
Your Personal Tour Guide
Ask me questions while you tour the home.