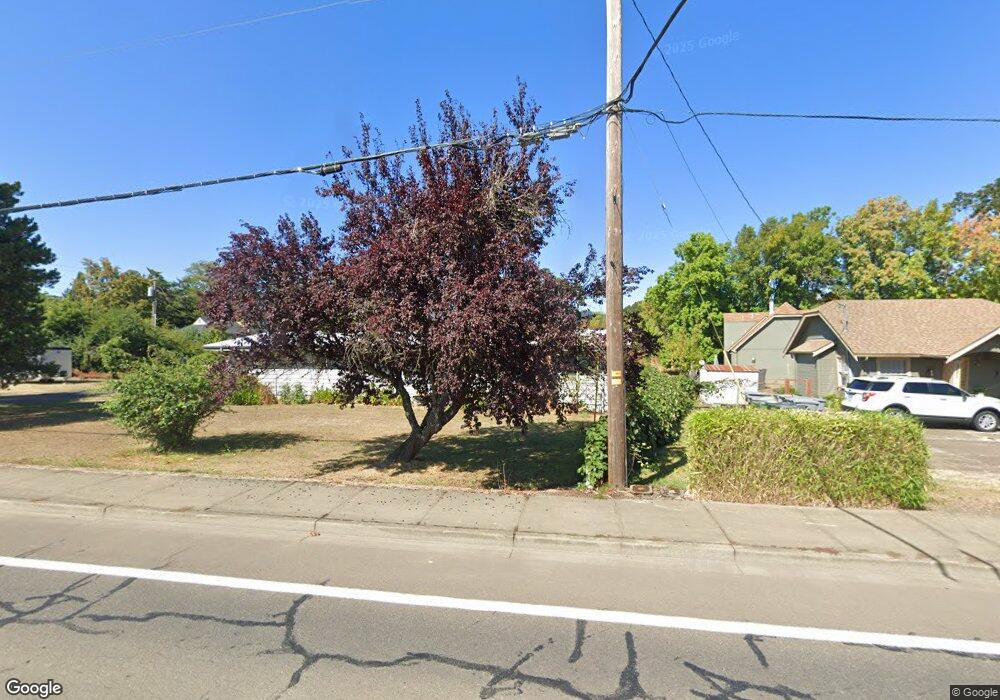
2037 Main St Philomath, OR 97370
Estimated Value: $384,000 - $503,462
3
Beds
2
Baths
1,690
Sq Ft
$253/Sq Ft
Est. Value
About This Home
This home is located at 2037 Main St, Philomath, OR 97370 and is currently estimated at $427,487, approximately $252 per square foot. 2037 Main St is a home located in Benton County with nearby schools including Clemens Primary School, Philomath Elementary School, and Philomath Middle School.
Ownership History
Date
Name
Owned For
Owner Type
Purchase Details
Closed on
Sep 18, 2018
Sold by
Bond Myrtle Irene
Bought by
Hackleman David E and Hackleman Debra M
Current Estimated Value
Home Financials for this Owner
Home Financials are based on the most recent Mortgage that was taken out on this home.
Original Mortgage
$153,500
Interest Rate
4.6%
Mortgage Type
Unknown
Purchase Details
Closed on
May 10, 2016
Sold by
Offspring Invesmtents Llc
Bought by
Lowther Land & Timber Llc
Purchase Details
Closed on
Mar 14, 2016
Sold by
Bond Bond Myrtle Irene Myrtle Irene
Bought by
Bond Myrtle Irene and Myrtle Irene Bond Trust
Purchase Details
Closed on
Jan 25, 2016
Sold by
Gerding Richard L
Bought by
Offspring Investments Llc
Purchase Details
Closed on
Jan 22, 2016
Sold by
Gerding Tricia R
Bought by
Gerding Richard L
Purchase Details
Closed on
Dec 29, 2005
Sold by
Riley Bond Myrtle Irene
Bought by
State Of Oregon and Department Of Transportation
Create a Home Valuation Report for This Property
The Home Valuation Report is an in-depth analysis detailing your home's value as well as a comparison with similar homes in the area
Home Values in the Area
Average Home Value in this Area
Purchase History
| Date | Buyer | Sale Price | Title Company |
|---|---|---|---|
| Hackleman David E | $278,000 | First American Title | |
| Lowther Land & Timber Llc | -- | Ticor Title | |
| Bond Myrtle Irene | -- | None Available | |
| Offspring Investments Llc | $210,000 | Ticor Title | |
| Gerding Richard L | -- | Ticor Title | |
| State Of Oregon | $5,373 | Amerititle |
Source: Public Records
Mortgage History
| Date | Status | Borrower | Loan Amount |
|---|---|---|---|
| Previous Owner | Hackleman David E | $153,500 |
Source: Public Records
Tax History Compared to Growth
Tax History
| Year | Tax Paid | Tax Assessment Tax Assessment Total Assessment is a certain percentage of the fair market value that is determined by local assessors to be the total taxable value of land and additions on the property. | Land | Improvement |
|---|---|---|---|---|
| 2025 | $3,781 | $187,025 | -- | -- |
| 2024 | $3,781 | $181,578 | -- | -- |
| 2023 | $3,584 | $176,289 | $0 | $0 |
| 2022 | $3,480 | $171,154 | $0 | $0 |
| 2021 | $3,381 | $166,169 | $0 | $0 |
| 2020 | $3,401 | $161,329 | $0 | $0 |
| 2019 | $3,157 | $156,630 | $0 | $0 |
| 2018 | $2,731 | $152,068 | $0 | $0 |
| 2017 | $2,668 | $147,639 | $0 | $0 |
| 2016 | $2,558 | $143,339 | $0 | $0 |
| 2015 | $2,421 | $139,164 | $0 | $0 |
| 2014 | $2,386 | $135,111 | $0 | $0 |
| 2012 | -- | $127,355 | $0 | $0 |
Source: Public Records
Map
Nearby Homes
- 135 S 21st St
- 240 N 19th St
- 235 S 18th St
- 1717 Main St
- 224 S 24th St
- 223 N 14th St
- 1502 Timothy St
- 2820 Newton Place
- 2759 Newton St
- 760 S 16th St
- 2892 Newton Place
- 346 Robb Place
- 345 N 11th (351) St
- 807 N 12th St
- 409 S 30th St
- 407 S 30th St
- 990 Pippa Ln
- 1284 N 19th St Unit 7 St
- 1284 N 19th St
- 1284 N 19th St Unit 4 St
- 2101 Main St
- 2018 College St
- 2103 Main St
- 111 N 20th St
- 201 N 20th Place
- 201 N 20th Place
- 125 N 20th St
- 201 206 265 N 20th Pl (1 42 Acres)
- 106 S 21st St
- 2004 College St
- 2121 Main St
- 259 N 20th Place
- 2030 Main St
- 118 S 21st St
- 115 S 21st St
- 261 N 20th Place
- 122 S 21st St
- 2120 Main St
- 1933 College St
- 2014 Main St