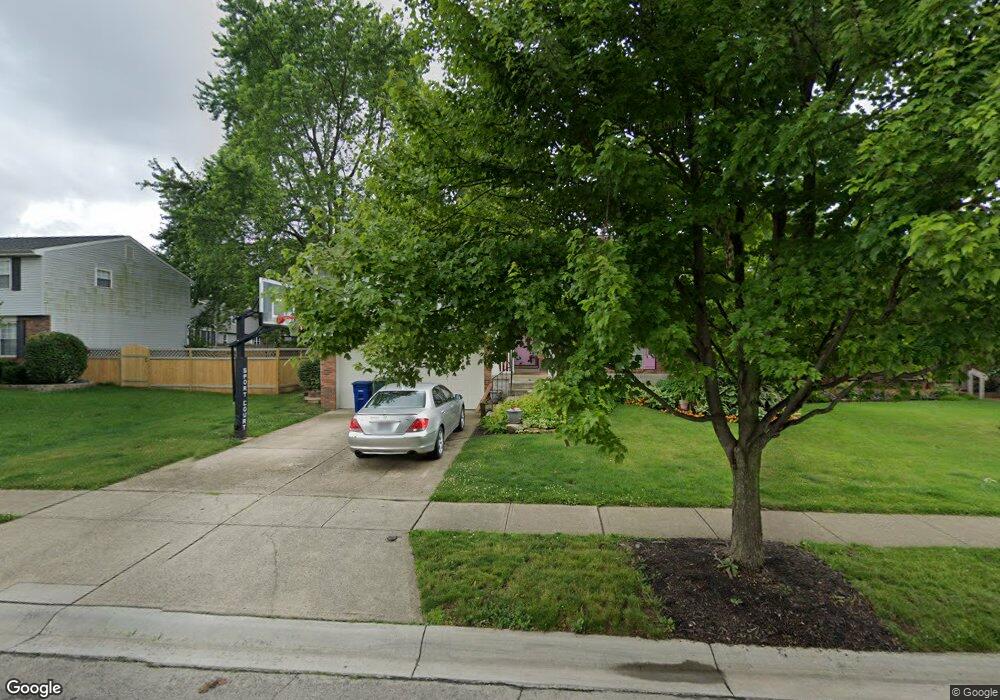
2037 Rolling Meadows Dr Columbus, OH 43228
Golfview Woods NeighborhoodEstimated Value: $313,904 - $349,000
3
Beds
2
Baths
1,378
Sq Ft
$239/Sq Ft
Est. Value
About This Home
This home is located at 2037 Rolling Meadows Dr, Columbus, OH 43228 and is currently estimated at $329,476, approximately $239 per square foot. 2037 Rolling Meadows Dr is a home located in Franklin County with nearby schools including Ridgewood Elementary School, Hilliard Station Sixth Grade Elementary School, and Hilliard Heritage Middle School.
Ownership History
Date
Name
Owned For
Owner Type
Purchase Details
Closed on
Sep 28, 2001
Sold by
Rhodes Brian P
Bought by
Sayre William G and Sayre Katherine E
Current Estimated Value
Home Financials for this Owner
Home Financials are based on the most recent Mortgage that was taken out on this home.
Original Mortgage
$122,970
Outstanding Balance
$46,328
Interest Rate
6.99%
Mortgage Type
FHA
Estimated Equity
$283,148
Purchase Details
Closed on
Jun 30, 1999
Sold by
Hermann Christine M
Bought by
Rhodes Brian P
Home Financials for this Owner
Home Financials are based on the most recent Mortgage that was taken out on this home.
Original Mortgage
$107,650
Interest Rate
7.69%
Purchase Details
Closed on
Aug 3, 1992
Bought by
Hermann Christine M
Purchase Details
Closed on
Oct 1, 1990
Purchase Details
Closed on
Jun 27, 1988
Create a Home Valuation Report for This Property
The Home Valuation Report is an in-depth analysis detailing your home's value as well as a comparison with similar homes in the area
Home Values in the Area
Average Home Value in this Area
Purchase History
| Date | Buyer | Sale Price | Title Company |
|---|---|---|---|
| Sayre William G | $124,900 | Chicago Title | |
| Rhodes Brian P | $111,000 | Celtic Title Agency Inc | |
| Hermann Christine M | $91,900 | -- | |
| -- | $83,000 | -- | |
| -- | $76,800 | -- |
Source: Public Records
Mortgage History
| Date | Status | Borrower | Loan Amount |
|---|---|---|---|
| Open | Sayre William G | $122,970 | |
| Closed | Rhodes Brian P | $107,650 |
Source: Public Records
Tax History
| Year | Tax Paid | Tax Assessment Tax Assessment Total Assessment is a certain percentage of the fair market value that is determined by local assessors to be the total taxable value of land and additions on the property. | Land | Improvement |
|---|---|---|---|---|
| 2025 | $4,863 | $86,100 | $33,600 | $52,500 |
| 2024 | $4,863 | $86,100 | $33,600 | $52,500 |
| 2023 | $4,213 | $86,100 | $33,600 | $52,500 |
| 2022 | $3,658 | $59,860 | $15,370 | $44,490 |
| 2021 | $3,654 | $59,860 | $15,370 | $44,490 |
| 2020 | $3,644 | $59,860 | $15,370 | $44,490 |
| 2019 | $3,424 | $48,030 | $12,290 | $35,740 |
| 2018 | $3,327 | $48,030 | $12,290 | $35,740 |
| 2017 | $3,410 | $48,030 | $12,290 | $35,740 |
| 2016 | $3,461 | $45,150 | $11,830 | $33,320 |
| 2015 | $3,243 | $45,150 | $11,830 | $33,320 |
| 2014 | $3,249 | $45,150 | $11,830 | $33,320 |
| 2013 | $1,646 | $45,150 | $11,830 | $33,320 |
Source: Public Records
Map
Nearby Homes
- 3691 Cannongate Dr
- 2176 Bigby Hollow St
- 3870 Cypress Creek Dr
- 3985 Spyglass Dr
- 1593 Raspberry Run Dr
- 2380 Quarry Trails Dr
- 2424 Quarry Trails Dr
- 2512 Quarry Trails Dr
- 2456 Quarry Trails Dr
- 2464 Quarry Trails Dr
- 2448 Quarry Trails Dr
- 2432 Quarry Trails Dr
- 2374 Quarry Trails Dr
- 2502 Quarry Trails Dr
- 2368 Quarry Trails Dr
- 2342 Quarry Trails Dr
- 3791 Farm Brook Ln
- 2867 Kobuk Dr Unit 404
- 2867 Kobuk Dr Unit 302
- 2867 Kobuk Dr Unit 202
- 2047 Rolling Meadows Dr
- 2025 Rolling Meadows Dr
- 1958 Charmingfare St
- 2048 Cannongate Ct
- 2055 Rolling Meadows Dr
- 2056 Cannongate Ct
- 1966 Charmingfare St
- 2038 Rolling Meadows Dr
- 2046 Rolling Meadows Dr
- 2030 Rolling Meadows Dr
- 2040 Cannongate Ct
- 2054 Rolling Meadows Dr
- 1974 Charmingfare St
- 2022 Rolling Meadows Dr
- 3705 Cannongate Dr
- 3669 Cannongate Dr
- 1982 Charmingfare St
- 1957 Charmingfare St
- 1951 Charmingfare St
- 2014 Rolling Meadows Dr
Your Personal Tour Guide
Ask me questions while you tour the home.