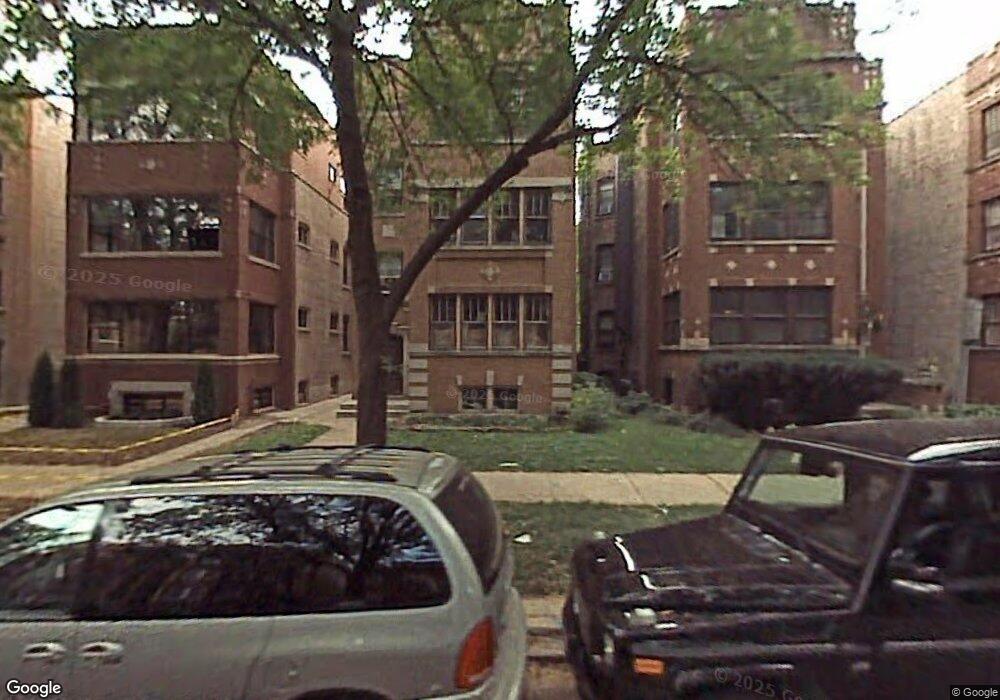
2037 W Farragut Ave Unit 3 Chicago, IL 60625
Bowmanville NeighborhoodEstimated Value: $394,201 - $541,000
2
Beds
2
Baths
6,120
Sq Ft
$77/Sq Ft
Est. Value
About This Home
This home is located at 2037 W Farragut Ave Unit 3, Chicago, IL 60625 and is currently estimated at $471,050, approximately $76 per square foot. 2037 W Farragut Ave Unit 3 is a home located in Cook County with nearby schools including Chappell Elementary School, Amundsen High School, and Rogers Park Montessori School.
Ownership History
Date
Name
Owned For
Owner Type
Purchase Details
Closed on
Feb 18, 2011
Sold by
Michael John and Michael Alice
Bought by
Richard Aline J and Richard Frederic A
Current Estimated Value
Create a Home Valuation Report for This Property
The Home Valuation Report is an in-depth analysis detailing your home's value as well as a comparison with similar homes in the area
Home Values in the Area
Average Home Value in this Area
Purchase History
| Date | Buyer | Sale Price | Title Company |
|---|---|---|---|
| Richard Aline J | $265,000 | None Available |
Source: Public Records
Tax History Compared to Growth
Tax History
| Year | Tax Paid | Tax Assessment Tax Assessment Total Assessment is a certain percentage of the fair market value that is determined by local assessors to be the total taxable value of land and additions on the property. | Land | Improvement |
|---|---|---|---|---|
| 2024 | $5,486 | $33,157 | $11,069 | $22,088 |
| 2023 | $5,348 | $26,000 | $8,900 | $17,100 |
| 2022 | $5,348 | $26,000 | $8,900 | $17,100 |
| 2021 | $5,228 | $25,999 | $8,900 | $17,099 |
| 2020 | $5,993 | $26,901 | $4,672 | $22,229 |
| 2019 | $6,149 | $30,603 | $4,672 | $25,931 |
| 2018 | $6,045 | $30,603 | $4,672 | $25,931 |
| 2017 | $5,732 | $26,625 | $4,005 | $22,620 |
| 2016 | $5,333 | $26,625 | $4,005 | $22,620 |
| 2015 | $4,879 | $26,625 | $4,005 | $22,620 |
| 2014 | $4,891 | $26,361 | $3,003 | $23,358 |
| 2013 | $4,794 | $26,361 | $3,003 | $23,358 |
Source: Public Records
Map
Nearby Homes
- 2055 W Farragut Ave Unit G
- 5221 N Hoyne Ave Unit 3
- 1968 W Foster Ave Unit D
- 5217 N Winchester Ave Unit 1S
- 1910 W Farragut Ave
- 5349 N Winchester Ave Unit 1
- 1835 W Summerdale Ave
- 2201 W Winona St Unit 2201G
- 1824 W Farragut Ave
- 1824 W Foster Ave Unit 302
- 5015 N Damen Ave
- 2307 W Foster Ave Unit 1
- 2307 W Foster Ave Unit 2
- 2307 W Foster Ave Unit 3
- 1949 W Argyle St Unit 19491
- 1740 W Foster Ave Unit 3R
- 4948 N Winchester Ave
- 5401-5447 N Wolcott Ave
- 1719 W Foster Ave
- 1776 W Winnemac Ave Unit 100
- 2037 W Farragut Ave Unit 1
- 2037 W Farragut Ave Unit 2
- 2037 W Farragut Ave
- 2037 W Farragut Ave Unit 3
- 2037 W Farragut Ave Unit 1
- 2037 W Farragut Ave Unit 2
- 2037 W Farragut Ave
- 2035 W Farragut Ave Unit 1
- 2035 W Farragut Ave Unit 3
- 2035 W Farragut Ave Unit 2
- 2035 W Farragut Ave Unit G
- 2041 W Farragut Ave
- 2041 W Farragut Ave Unit G
- 2031 W Farragut Ave Unit 3
- 2031 W Farragut Ave Unit 2
- 2031 W Farragut Ave Unit 4
- 2031 W Farragut Ave Unit 1
- 2045 W Farragut Ave Unit 2
- 2027 W Farragut Ave
- 2047 W Farragut Ave