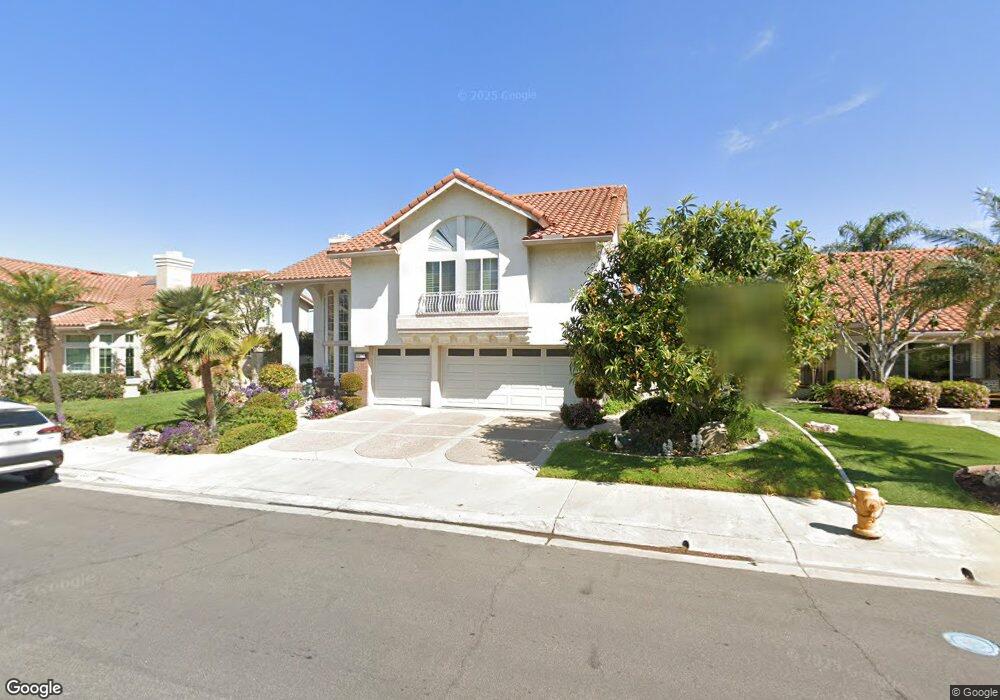
20371 Via Guadalupe Yorba Linda, CA 92887
Estimated Value: $1,825,000 - $1,888,284
3
Beds
4
Baths
3,209
Sq Ft
$577/Sq Ft
Est. Value
About This Home
This home is located at 20371 Via Guadalupe, Yorba Linda, CA 92887 and is currently estimated at $1,851,071, approximately $576 per square foot. 20371 Via Guadalupe is a home located in Orange County with nearby schools including Glenknoll Elementary, Bernardo Yorba Middle School, and Ivycrest Montessori Private School - Yorba Linda.
Ownership History
Date
Name
Owned For
Owner Type
Purchase Details
Closed on
May 24, 2004
Sold by
Allevato Louis and Allevato Catherina
Bought by
Allevato Louis and Allevato Catherina P
Current Estimated Value
Purchase Details
Closed on
May 22, 2003
Sold by
Rezaei Asghar and Rezaei Mojgan
Bought by
Allevato Louis and Allevato Catherina
Home Financials for this Owner
Home Financials are based on the most recent Mortgage that was taken out on this home.
Original Mortgage
$575,000
Outstanding Balance
$242,247
Interest Rate
5.37%
Mortgage Type
Purchase Money Mortgage
Estimated Equity
$1,608,824
Purchase Details
Closed on
Jun 17, 1996
Sold by
Upper K Shapell Joint Venture
Bought by
Rezaei Asghar and Rezaei Mojgan
Home Financials for this Owner
Home Financials are based on the most recent Mortgage that was taken out on this home.
Original Mortgage
$329,600
Interest Rate
8.32%
Create a Home Valuation Report for This Property
The Home Valuation Report is an in-depth analysis detailing your home's value as well as a comparison with similar homes in the area
Home Values in the Area
Average Home Value in this Area
Purchase History
| Date | Buyer | Sale Price | Title Company |
|---|---|---|---|
| Allevato Louis | -- | -- | |
| Allevato Louis | $720,000 | -- | |
| Rezaei Asghar | $418,000 | Chicago Title Co |
Source: Public Records
Mortgage History
| Date | Status | Borrower | Loan Amount |
|---|---|---|---|
| Open | Allevato Louis | $575,000 | |
| Previous Owner | Rezaei Asghar | $329,600 |
Source: Public Records
Tax History Compared to Growth
Tax History
| Year | Tax Paid | Tax Assessment Tax Assessment Total Assessment is a certain percentage of the fair market value that is determined by local assessors to be the total taxable value of land and additions on the property. | Land | Improvement |
|---|---|---|---|---|
| 2025 | $12,328 | $1,042,793 | $666,125 | $376,668 |
| 2024 | $12,328 | $1,022,347 | $653,064 | $369,283 |
| 2023 | $12,101 | $1,002,301 | $640,258 | $362,043 |
| 2022 | $11,942 | $982,649 | $627,704 | $354,945 |
| 2021 | $11,715 | $963,382 | $615,396 | $347,986 |
| 2020 | $11,611 | $953,504 | $609,086 | $344,418 |
| 2019 | $11,205 | $934,808 | $597,143 | $337,665 |
| 2018 | $11,048 | $916,479 | $585,434 | $331,045 |
| 2017 | $10,859 | $898,509 | $573,955 | $324,554 |
| 2016 | $10,576 | $880,892 | $562,701 | $318,191 |
| 2015 | $10,136 | $867,661 | $554,249 | $313,412 |
| 2014 | $9,839 | $850,665 | $543,392 | $307,273 |
Source: Public Records
Map
Nearby Homes
- 20455 Via Cadiz
- 20520 Via Magdalena
- 5289 Via Andalusia
- 5505 Calle Vista Linda
- 20770 Paseo de la Rambla
- 5795 Via Perla
- 19762 Ridgewood Place
- 19862 Le Mans Cir
- 19931 Crestknoll Dr
- 6191 Jacaranda Ln
- 6375 Tiburon Terrace
- 5851 Via Santana
- 19761 Burleigh Dr
- 4832 Via Frondosa
- 20065 Berkeley Way
- 20754 Tulip Cir
- 20709 Calle Pera
- 20453 Elm Hill Ln Unit 26
- 19831 Caprice Dr
- 5317 Via Ramon Rd
- 20361 Via Guadalupe
- 20381 Via Guadalupe
- 20380 Via Celestina
- 20391 Via Guadalupe
- 20351 Via Guadalupe
- 20390 Via Celestina
- 20371 Via Varadero
- 20381 Via Varadero
- 20401 Via Guadalupe
- 20347 Via Guadalupe
- 20391 Via Varadero
- 20400 Via Celestina
- 20361 Via Celestina
- 20371 Via Celestina
- 20351 Via Varadero
- 20357 Via Celestina
- 20411 Via Guadalupe
- 20381 Via Celestina
- 20341 Via Guadalupe
- 20460 Via Celestina