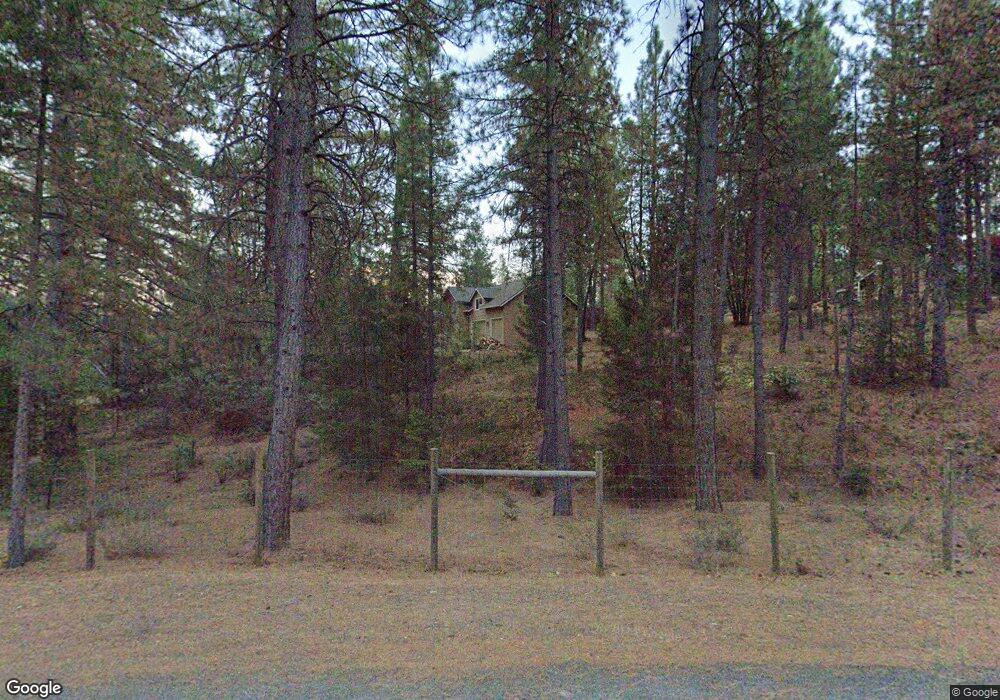
20376 Red Dog Rd Grass Valley, CA 95945
Estimated Value: $410,000 - $554,000
2
Beds
1
Bath
1,402
Sq Ft
$334/Sq Ft
Est. Value
About This Home
This home is located at 20376 Red Dog Rd, Grass Valley, CA 95945 and is currently estimated at $468,606, approximately $334 per square foot. 20376 Red Dog Rd is a home located in Nevada County with nearby schools including Deer Creek Elementary School and Seven Hills Intermediate School.
Ownership History
Date
Name
Owned For
Owner Type
Purchase Details
Closed on
Oct 18, 2022
Sold by
St Germain Robert & Elesa
Bought by
Robert A St Germain And Elesa St Germain Revo
Current Estimated Value
Purchase Details
Closed on
May 8, 1998
Sold by
Biggs Richard E and Biggs Harold W
Bought by
Stgermain Robert A and Stgermain Elesa
Home Financials for this Owner
Home Financials are based on the most recent Mortgage that was taken out on this home.
Original Mortgage
$44,000
Interest Rate
7.05%
Mortgage Type
Seller Take Back
Purchase Details
Closed on
Apr 29, 1998
Sold by
Biggs Richard E and Biggs Harold W
Bought by
Stgermain Robert A and Stgermain Elesa
Home Financials for this Owner
Home Financials are based on the most recent Mortgage that was taken out on this home.
Original Mortgage
$44,000
Interest Rate
7.05%
Mortgage Type
Seller Take Back
Create a Home Valuation Report for This Property
The Home Valuation Report is an in-depth analysis detailing your home's value as well as a comparison with similar homes in the area
Home Values in the Area
Average Home Value in this Area
Purchase History
| Date | Buyer | Sale Price | Title Company |
|---|---|---|---|
| Robert A St Germain And Elesa St Germain Revo | -- | -- | |
| Stgermain Robert A | -- | Placer Title Company | |
| Stgermain Robert A | -- | Placer Title Company | |
| Stgermain Robert A | $55,000 | Placer Title Company |
Source: Public Records
Mortgage History
| Date | Status | Borrower | Loan Amount |
|---|---|---|---|
| Previous Owner | Stgermain Robert A | $44,000 |
Source: Public Records
Tax History Compared to Growth
Tax History
| Year | Tax Paid | Tax Assessment Tax Assessment Total Assessment is a certain percentage of the fair market value that is determined by local assessors to be the total taxable value of land and additions on the property. | Land | Improvement |
|---|---|---|---|---|
| 2025 | $3,476 | $342,499 | $122,631 | $219,868 |
| 2024 | $3,411 | $335,784 | $120,227 | $215,557 |
| 2023 | $3,411 | $329,201 | $117,870 | $211,331 |
| 2022 | $3,341 | $322,747 | $115,559 | $207,188 |
| 2021 | $3,249 | $316,420 | $113,294 | $203,126 |
| 2020 | $3,243 | $313,177 | $112,133 | $201,044 |
| 2019 | $3,177 | $307,037 | $109,935 | $197,102 |
| 2018 | $0 | $301,018 | $107,780 | $193,238 |
| 2017 | $3,054 | $295,117 | $105,667 | $189,450 |
| 2016 | $2,941 | $289,332 | $103,596 | $185,736 |
| 2015 | $2,899 | $284,987 | $102,040 | $182,947 |
| 2014 | $2,854 | $279,406 | $100,042 | $179,364 |
Source: Public Records
Map
Nearby Homes
- 18768 You Bet Rd
- 18921 Greenhorn Rd
- 17100 Fritillary Way
- 17721 Knoll Top Dr
- 15623 Chicago Park Powerhouse Rd
- 16949 Jones Ridge Rd
- 16890 Red Dog Rd
- 14295 Arrowhead Mine Rd
- 16856 Red Dog Rd
- 14341 Arrowhead Mine Rd
- 14788 Arrowhead Mine Rd
- 0 Old Donner Trail
- 15470 Old Donner Trail
- 13999 Fifield Rd
- 16425 Jones Ridge Rd
- 12755 Red Dog Rd
- 16805 Jones Ridge Rd
- 16312 Jones Ridge Rd
- 13928 Manion Canyon Rd
- 17529 Chicago Park Powerhouse Rd
- 20224 Red Dog Rd
- 26092 Grass View Ln
- 20307 Red Dog Rd
- 21190 New Deal Rd
- 20520 Red Dog Rd
- 20100 Red Dog Rd
- 17790 Inside Straight
- 20674 Red Dog Rd
- 26206 Grass View Ln
- 18075 Eaglenest Rd
- 20519 Red Dog Rd
- 18015 Eaglenest Rd
- 20641 Red Dog Rd
- 18070 Eaglenest Rd
- 0 Eaglenest Rd
- 19966 Red Dog Rd
- 20818 Red Dog Rd
- 17501 Lawton Way
- 16871 Autumn Oak Rd
- 20717 Red Dog Rd