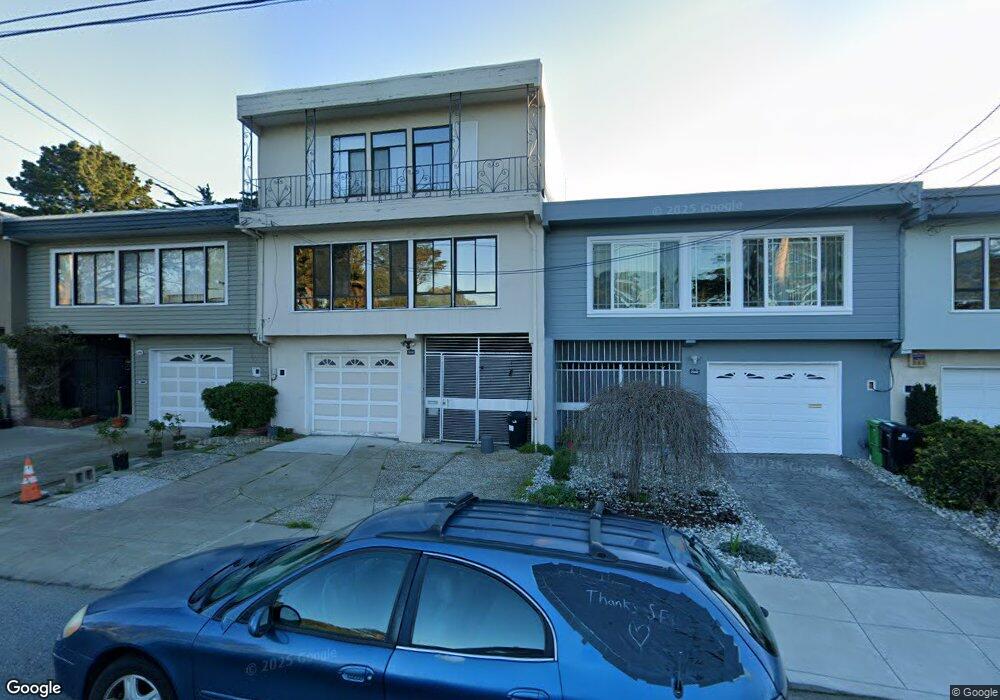
2038 36th Ave San Francisco, CA 94116
Parkside NeighborhoodEstimated Value: $1,837,000 - $2,102,000
5
Beds
4
Baths
2,464
Sq Ft
$795/Sq Ft
Est. Value
About This Home
This home is located at 2038 36th Ave, San Francisco, CA 94116 and is currently estimated at $1,958,339, approximately $794 per square foot. 2038 36th Ave is a home located in San Francisco County with nearby schools including Stevenson (Robert Louis) Elementary School, Giannini (A.P.) Middle School, and Holy Name Elementary School.
Ownership History
Date
Name
Owned For
Owner Type
Purchase Details
Closed on
Dec 31, 2015
Sold by
Chan Christopher
Bought by
Chan Christopher S
Current Estimated Value
Purchase Details
Closed on
Jun 13, 2012
Sold by
Chan Johnny and Chan Simon
Bought by
Chan Christopher
Home Financials for this Owner
Home Financials are based on the most recent Mortgage that was taken out on this home.
Original Mortgage
$417,000
Outstanding Balance
$288,453
Interest Rate
3.79%
Mortgage Type
New Conventional
Estimated Equity
$1,669,886
Purchase Details
Closed on
May 28, 2003
Sold by
Chan Shu Pun
Bought by
Chan Shu Pun
Purchase Details
Closed on
Feb 6, 1995
Sold by
Chater Developments Inc
Bought by
Chater Developments Inc
Home Financials for this Owner
Home Financials are based on the most recent Mortgage that was taken out on this home.
Original Mortgage
$400,000
Interest Rate
9.21%
Create a Home Valuation Report for This Property
The Home Valuation Report is an in-depth analysis detailing your home's value as well as a comparison with similar homes in the area
Home Values in the Area
Average Home Value in this Area
Purchase History
| Date | Buyer | Sale Price | Title Company |
|---|---|---|---|
| Chan Christopher S | -- | None Available | |
| Chan Christopher | $650,000 | Old Republic Title Company | |
| Chan Shu Pun | -- | -- | |
| Chater Developments Inc | -- | Old Republic Title Company |
Source: Public Records
Mortgage History
| Date | Status | Borrower | Loan Amount |
|---|---|---|---|
| Open | Chan Christopher | $417,000 | |
| Previous Owner | Chater Developments Inc | $400,000 |
Source: Public Records
Tax History Compared to Growth
Tax History
| Year | Tax Paid | Tax Assessment Tax Assessment Total Assessment is a certain percentage of the fair market value that is determined by local assessors to be the total taxable value of land and additions on the property. | Land | Improvement |
|---|---|---|---|---|
| 2025 | $10,084 | $816,426 | $571,499 | $244,927 |
| 2024 | $10,084 | $800,419 | $560,294 | $240,125 |
| 2023 | $9,925 | $784,725 | $549,308 | $235,417 |
| 2022 | $9,726 | $769,339 | $538,538 | $230,801 |
| 2021 | $9,550 | $754,255 | $527,979 | $226,276 |
| 2020 | $9,603 | $746,522 | $522,566 | $223,956 |
| 2019 | $9,275 | $731,885 | $512,320 | $219,565 |
| 2018 | $8,962 | $717,535 | $502,275 | $215,260 |
| 2017 | $8,557 | $703,467 | $492,427 | $211,040 |
| 2016 | $8,419 | $689,674 | $482,772 | $206,902 |
| 2015 | $8,416 | $679,316 | $475,521 | $203,795 |
| 2014 | $8,195 | $666,010 | $466,207 | $199,803 |
Source: Public Records
Map
Nearby Homes