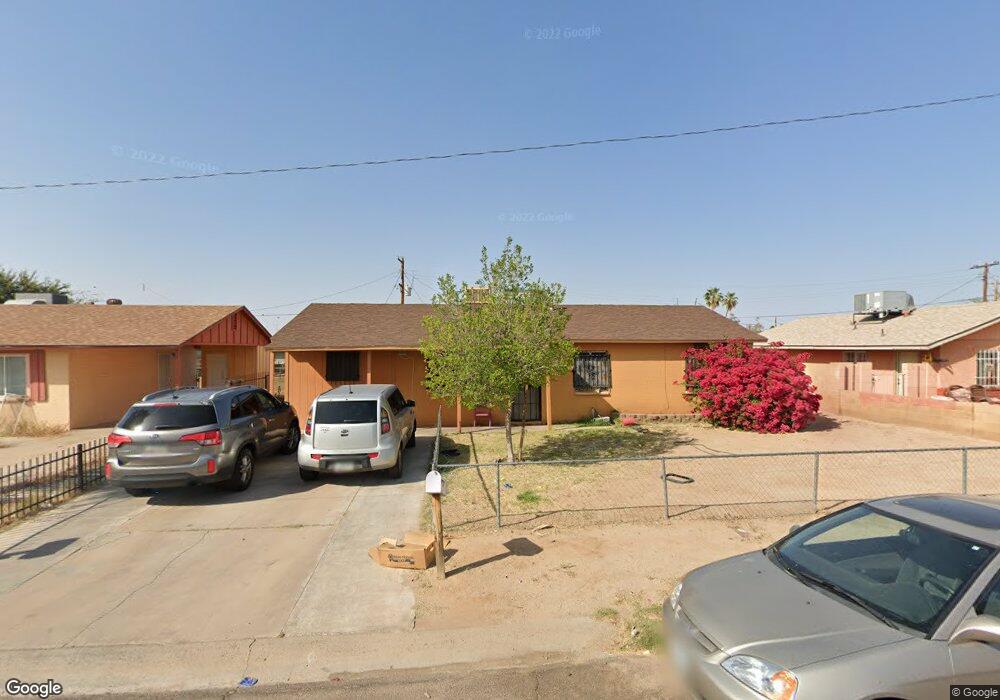
2038 E Saint Charles Ave Phoenix, AZ 85042
South Mountain NeighborhoodEstimated Value: $233,000 - $298,000
--
Bed
1
Bath
1,150
Sq Ft
$226/Sq Ft
Est. Value
About This Home
This home is located at 2038 E Saint Charles Ave, Phoenix, AZ 85042 and is currently estimated at $260,038, approximately $226 per square foot. 2038 E Saint Charles Ave is a home located in Maricopa County with nearby schools including T G Barr School, South Mountain High School, and Phoenix Coding Academy.
Ownership History
Date
Name
Owned For
Owner Type
Purchase Details
Closed on
Oct 15, 2003
Sold by
Pizano Jose
Bought by
Perkins David L
Current Estimated Value
Home Financials for this Owner
Home Financials are based on the most recent Mortgage that was taken out on this home.
Original Mortgage
$77,309
Outstanding Balance
$35,676
Interest Rate
6.4%
Mortgage Type
FHA
Estimated Equity
$224,362
Purchase Details
Closed on
Dec 11, 2001
Sold by
Pizano Rosa
Bought by
Pizano Jose
Purchase Details
Closed on
Dec 7, 2001
Sold by
Hud
Bought by
Pizano Jose
Purchase Details
Closed on
Aug 25, 1999
Sold by
Mellon Mtg Company
Bought by
Hud
Purchase Details
Closed on
Aug 6, 1997
Sold by
Chavez Joe S and Chavez Armida S
Bought by
Mellon Mtg Company
Create a Home Valuation Report for This Property
The Home Valuation Report is an in-depth analysis detailing your home's value as well as a comparison with similar homes in the area
Home Values in the Area
Average Home Value in this Area
Purchase History
| Date | Buyer | Sale Price | Title Company |
|---|---|---|---|
| Perkins David L | $78,000 | Security Title Agency | |
| Pizano Jose | -- | First American Title | |
| Pizano Jose | $58,000 | First American Title | |
| Hud | -- | -- | |
| Mellon Mtg Company | $51,561 | -- | |
| Mellon Mtg Company | -- | -- |
Source: Public Records
Mortgage History
| Date | Status | Borrower | Loan Amount |
|---|---|---|---|
| Open | Perkins David L | $77,309 |
Source: Public Records
Tax History
| Year | Tax Paid | Tax Assessment Tax Assessment Total Assessment is a certain percentage of the fair market value that is determined by local assessors to be the total taxable value of land and additions on the property. | Land | Improvement |
|---|---|---|---|---|
| 2025 | $454 | $3,010 | -- | -- |
| 2024 | $430 | $2,867 | -- | -- |
| 2023 | $430 | $17,700 | $3,540 | $14,160 |
| 2022 | $421 | $13,700 | $2,740 | $10,960 |
| 2021 | $430 | $10,820 | $2,160 | $8,660 |
| 2020 | $424 | $9,910 | $1,980 | $7,930 |
| 2019 | $410 | $7,810 | $1,560 | $6,250 |
| 2018 | $360 | $6,830 | $1,360 | $5,470 |
| 2017 | $335 | $5,450 | $1,090 | $4,360 |
| 2016 | $318 | $3,620 | $720 | $2,900 |
| 2015 | $296 | $2,950 | $590 | $2,360 |
Source: Public Records
Map
Nearby Homes
- 6602 S 22nd Place
- 2208 E Alta Vista Rd
- 6408 S 19th Place
- 6211 S 21st St
- 6444 S 23rd Place
- 2242 E Nancy Ln
- 2315 E Nancy Ln
- 2301 E Lynne Ln
- 2430 E Saint Anne Ave
- 5749 S 21st Terrace Unit 167
- 2257 E Huntington Dr Unit 171
- 2264 E Huntington Dr Unit 133
- 2323 E Huntington Dr
- 2282 E Hidalgo Ave
- 1653 E Vineyard Rd
- 2442 E Glass Ln
- 2367 E Huntington Dr Unit 203
- 5617 S 21st Place
- 2335 E Hidalgo Ave
- 2517 E Novak Way
- 2032 E Saint Charles Ave
- 2042 E Saint Charles Ave
- 2041 E Saint Anne Ave
- 2028 E Saint Charles Ave
- 2046 E Saint Charles Ave
- 2037 E Saint Anne Ave
- 2047 E Saint Anne Ave
- 2033 E Saint Charles Ave
- 2031 E Saint Anne Ave
- 2022 E Saint Charles Ave
- 2052 E Saint Charles Ave
- 2039 E Saint Charles Ave
- 2051 E Saint Anne Ave
- 2045 E Saint Charles Ave Unit III
- 2025 E Saint Anne Ave
- 2049 E Saint Charles Ave
- 2018 E Saint Charles Ave
- 6521 S 20th Place
- 2029 E Saint Charles Ave
- 2053 E Saint Charles Ave
Your Personal Tour Guide
Ask me questions while you tour the home.