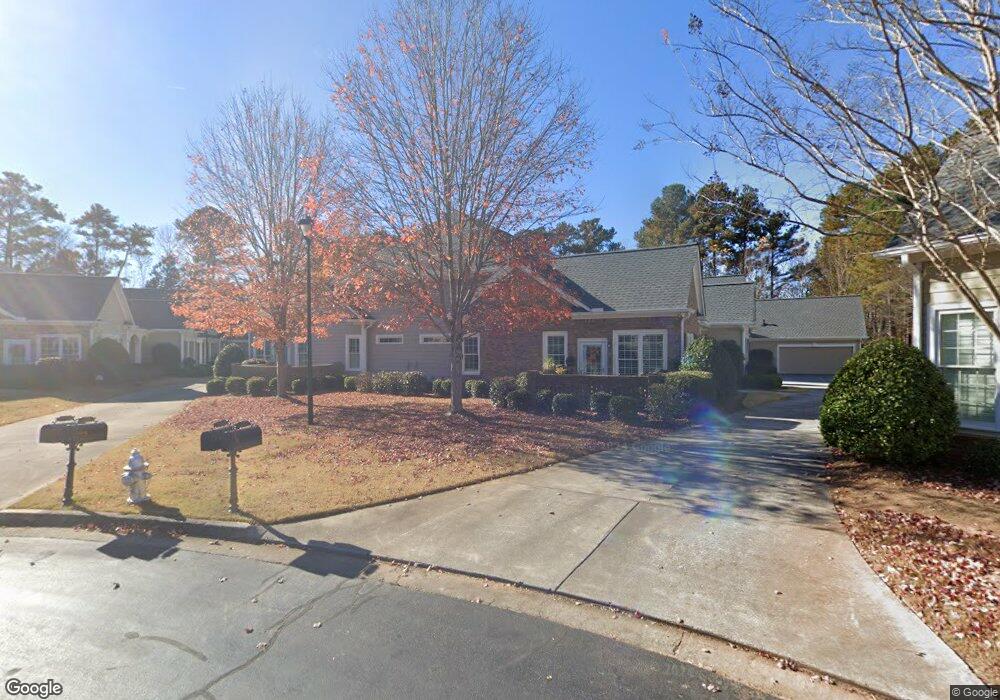
2038 MacLand Square Dr Unit 5 Marietta, GA 30064
Estimated Value: $363,866 - $380,000
2
Beds
2
Baths
1,643
Sq Ft
$227/Sq Ft
Est. Value
About This Home
This home is located at 2038 MacLand Square Dr Unit 5, Marietta, GA 30064 and is currently estimated at $372,717, approximately $226 per square foot. 2038 MacLand Square Dr Unit 5 is a home located in Cobb County with nearby schools including Dowell Elementary School, Lovinggood Middle School, and Hillgrove High School.
Ownership History
Date
Name
Owned For
Owner Type
Purchase Details
Closed on
Dec 21, 2022
Sold by
Hornsby Terrance J
Bought by
T Hornsby Family Trust
Current Estimated Value
Purchase Details
Closed on
Oct 19, 2021
Sold by
Potter Susan M
Bought by
Hornsby Terrance J
Home Financials for this Owner
Home Financials are based on the most recent Mortgage that was taken out on this home.
Original Mortgage
$308,750
Interest Rate
2.8%
Mortgage Type
New Conventional
Purchase Details
Closed on
Jun 27, 2014
Sold by
Hedrick Rita M
Bought by
Potter Susan M
Home Financials for this Owner
Home Financials are based on the most recent Mortgage that was taken out on this home.
Original Mortgage
$145,000
Interest Rate
4.17%
Mortgage Type
New Conventional
Purchase Details
Closed on
Mar 16, 2007
Sold by
Cir W Construction Co Inc
Bought by
Hedrick Rita
Create a Home Valuation Report for This Property
The Home Valuation Report is an in-depth analysis detailing your home's value as well as a comparison with similar homes in the area
Home Values in the Area
Average Home Value in this Area
Purchase History
| Date | Buyer | Sale Price | Title Company |
|---|---|---|---|
| T Hornsby Family Trust | -- | -- | |
| Hornsby Terrance J | $325,000 | None Listed On Document | |
| Potter Susan M | $185,000 | -- | |
| Hedrick Rita | $272,000 | -- |
Source: Public Records
Mortgage History
| Date | Status | Borrower | Loan Amount |
|---|---|---|---|
| Previous Owner | Hornsby Terrance J | $308,750 | |
| Previous Owner | Potter Susan M | $145,000 |
Source: Public Records
Tax History Compared to Growth
Tax History
| Year | Tax Paid | Tax Assessment Tax Assessment Total Assessment is a certain percentage of the fair market value that is determined by local assessors to be the total taxable value of land and additions on the property. | Land | Improvement |
|---|---|---|---|---|
| 2025 | $1,231 | $140,244 | $20,800 | $119,444 |
| 2024 | $1,234 | $140,244 | $20,800 | $119,444 |
| 2023 | $1,028 | $140,244 | $20,800 | $119,444 |
| 2022 | $3,226 | $106,288 | $20,800 | $85,488 |
| 2021 | $749 | $106,288 | $20,800 | $85,488 |
| 2020 | $751 | $107,096 | $20,800 | $86,296 |
| 2019 | $751 | $107,096 | $20,800 | $86,296 |
| 2018 | $700 | $89,856 | $16,000 | $73,856 |
| 2017 | $619 | $89,856 | $16,000 | $73,856 |
| 2016 | $568 | $72,856 | $16,000 | $56,856 |
| 2015 | $606 | $72,856 | $16,000 | $56,856 |
| 2014 | $1,853 | $62,372 | $0 | $0 |
Source: Public Records
Map
Nearby Homes
- 2028 MacLand Square Dr Unit 4
- 2002 MacLand Square Dr Unit 1
- 1952 Freestone Way
- 1946 MacLand Rd SW
- Monteluce Plan at Freestone Station
- Hillside Plan at Freestone Station
- Oakshire Plan at Freestone Station
- Hendricks Plan at Freestone Station
- Hedgerow Plan at Freestone Station
- Antioch Plan at Freestone Station
- 1976 Grove Field Ln
- 1976 Grove Field Ln Unit BLDG 33
- 1830 MacLand Rd SW
- 2268 Grove Valley Way Unit 9
- 1985 Freestone Way
- 2009 Freestone Way
- 2040 Freestone Way
- 2040 Hardwood Cir SW Unit 3
- 2409 Caneridge Point SW
- 2146 Caneridge Dr SW
- 2038 MacLand Square Dr Unit 2038
- 2038 MacLand Square Dr
- 2036 MacLand Square Dr Unit 17
- 2036 MacLand Square Dr Unit 5
- 2040 MacLand Square Dr Unit 5
- 2040 MacLand Square Dr Unit 2040
- 2040 MacLand Square Dr
- 2034 MacLand Square Dr Unit 18
- 2034 MacLand Square Dr Unit 5
- 2044 MacLand Square Dr
- 2042 MacLand Square Dr Unit 6
- 2043 MacLand Square Dr Unit 24
- 2043 MacLand Square Dr Unit 6
- 2030 MacLand Square Dr Unit 16
- 2030 MacLand Square Dr
- 2037 MacLand Square Dr Unit 7
- 2041 MacLand Square Dr Unit 6
- 2032 MacLand Square Dr Unit 4
- 2028 MacLand Square Dr
- 2035 MacLand Square Dr Unit 28