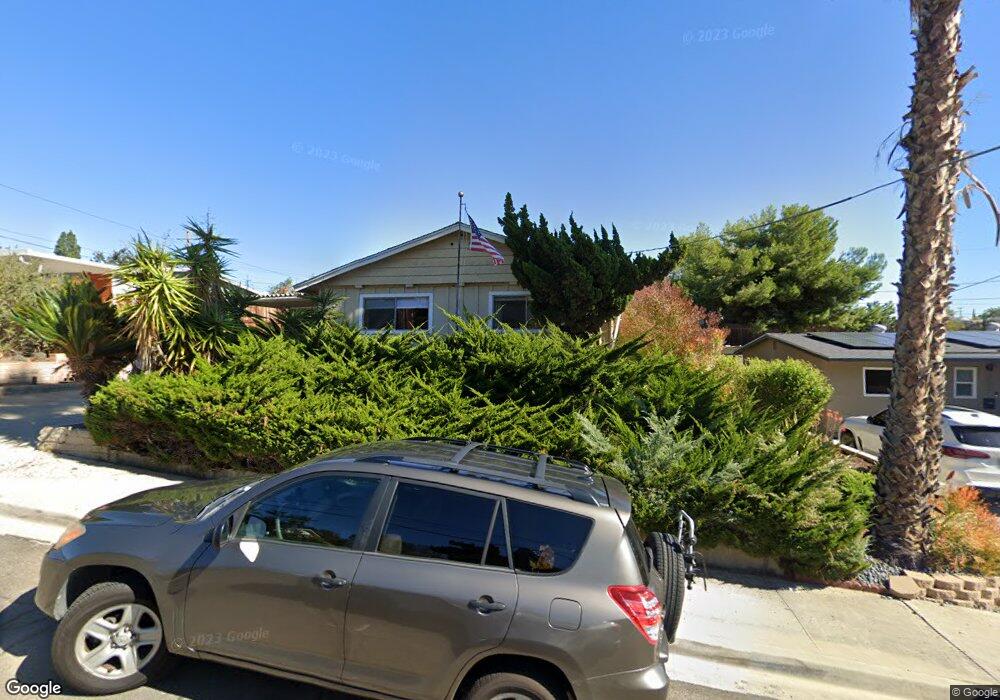
2039 Boundary St San Diego, CA 92104
North Park NeighborhoodEstimated Value: $1,023,883 - $1,314,000
3
Beds
2
Baths
1,293
Sq Ft
$924/Sq Ft
Est. Value
About This Home
This home is located at 2039 Boundary St, San Diego, CA 92104 and is currently estimated at $1,194,221, approximately $923 per square foot. 2039 Boundary St is a home located in San Diego County with nearby schools including McKinley Elementary School, Roosevelt International Middle School, and Mcgill School Of Success.
Ownership History
Date
Name
Owned For
Owner Type
Purchase Details
Closed on
Sep 14, 2022
Sold by
Murillo Victor R and Murillo Vickie
Bought by
Murillo Kuchinsky Trust and Murillo
Current Estimated Value
Purchase Details
Closed on
Mar 7, 2007
Sold by
Wessel Margaret M
Bought by
Murrillo Victor R and Kuchinsky Vickie
Home Financials for this Owner
Home Financials are based on the most recent Mortgage that was taken out on this home.
Original Mortgage
$96,600
Interest Rate
6.01%
Mortgage Type
Stand Alone Second
Create a Home Valuation Report for This Property
The Home Valuation Report is an in-depth analysis detailing your home's value as well as a comparison with similar homes in the area
Home Values in the Area
Average Home Value in this Area
Purchase History
| Date | Buyer | Sale Price | Title Company |
|---|---|---|---|
| Murillo Kuchinsky Trust | -- | None Listed On Document | |
| Murrillo Victor R | $483,000 | California Title Company |
Source: Public Records
Mortgage History
| Date | Status | Borrower | Loan Amount |
|---|---|---|---|
| Previous Owner | Murrillo Victor R | $96,600 | |
| Previous Owner | Murrillo Victor R | $386,400 |
Source: Public Records
Tax History Compared to Growth
Tax History
| Year | Tax Paid | Tax Assessment Tax Assessment Total Assessment is a certain percentage of the fair market value that is determined by local assessors to be the total taxable value of land and additions on the property. | Land | Improvement |
|---|---|---|---|---|
| 2025 | $7,740 | $647,079 | $261,241 | $385,838 |
| 2024 | $7,740 | $634,392 | $256,119 | $378,273 |
| 2023 | $7,567 | $621,954 | $251,098 | $370,856 |
| 2022 | $7,365 | $609,760 | $246,175 | $363,585 |
| 2021 | $7,313 | $597,805 | $241,349 | $356,456 |
| 2020 | $7,223 | $591,676 | $238,875 | $352,801 |
| 2019 | $7,093 | $580,076 | $234,192 | $345,884 |
| 2018 | $6,630 | $568,702 | $229,600 | $339,102 |
| 2017 | $80 | $525,000 | $210,000 | $315,000 |
| 2016 | $5,349 | $460,000 | $184,000 | $276,000 |
| 2015 | $4,763 | $410,000 | $164,000 | $246,000 |
| 2014 | $4,192 | $360,000 | $144,000 | $216,000 |
Source: Public Records
Map
Nearby Homes
- 2035 Haller St
- 2170 Montclair St
- 1742 Rowan St
- 1804 Colonial Ave
- 2280-82 Pentuckett Ave
- 2382 Haller St
- 3171 3175 K St
- 441 443 N 41st St
- 348 & 350 27th St
- 2215 Marigold Place
- 1720 Midvale Dr
- 1505 Bridgeview Dr
- 1480 Bridgeview Dr
- 3606 Maple St Unit 12
- 2541 Haller St
- 2609 Montclair St Unit 11
- 3688 Cactusview Dr
- 2661 Montclair St
- 2685 Montclair St
- 3665 Ash St Unit 7
- 2051 Boundary St
- 2027 Boundary St
- 2038 Montclair St
- 2068 Montclair St
- 2063 Boundary St
- 2084 Montclair St
- 2036 Boundary St
- 2048 Boundary St
- 2024 Boundary St
- 2094 Montclair St
- 2115 Boundary St
- 2062 Boundary St
- 2015 Montclair St
- 2012 Boundary St
- 2025 Montclair St
- 2005 Montclair St
- 2035 Montclair St
- 2045 Montclair St
- 2110 Montclair St
- 2065 Montclair St