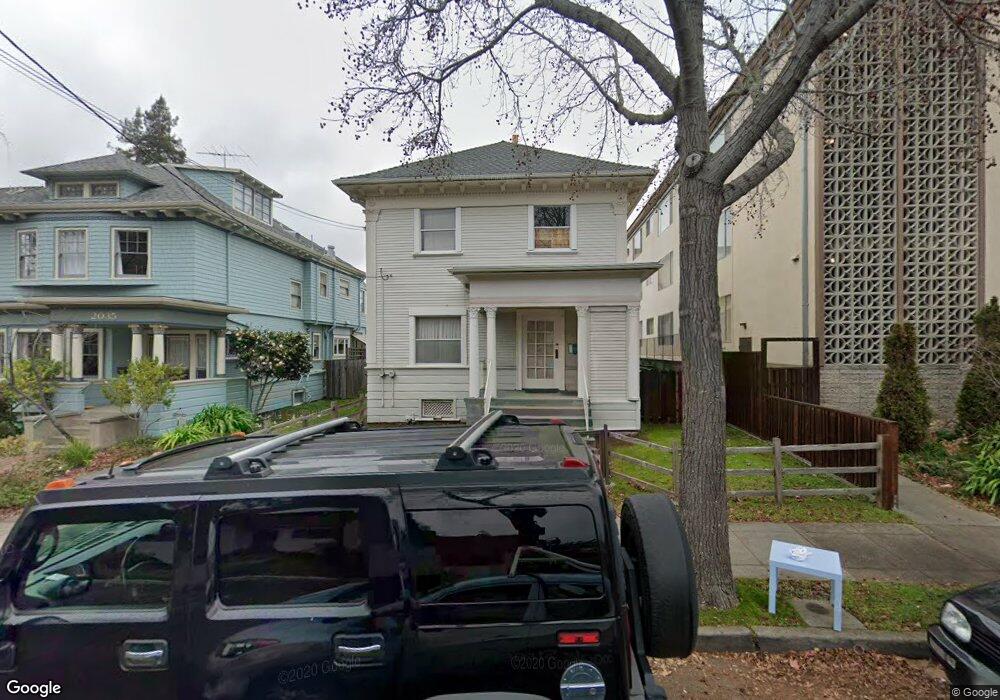
2039 Francisco St Berkeley, CA 94709
North Berkeley NeighborhoodEstimated Value: $1,626,198 - $1,881,000
4
Beds
2
Baths
2,158
Sq Ft
$828/Sq Ft
Est. Value
About This Home
This home is located at 2039 Francisco St, Berkeley, CA 94709 and is currently estimated at $1,787,800, approximately $828 per square foot. 2039 Francisco St is a home located in Alameda County with nearby schools including Berkeley Arts Magnet at Whittier School, Washington Elementary School, and Oxford Elementary School.
Ownership History
Date
Name
Owned For
Owner Type
Purchase Details
Closed on
Feb 2, 2010
Sold by
Humphreys Charles M and Humphreys Scott M
Bought by
Humphreys Charles Mcniven and The Charles Mcniven Humphreys
Current Estimated Value
Purchase Details
Closed on
Sep 23, 1999
Sold by
Humphreys Maurine
Bought by
Humphreys Scott M
Home Financials for this Owner
Home Financials are based on the most recent Mortgage that was taken out on this home.
Original Mortgage
$100,000
Outstanding Balance
$29,988
Interest Rate
7.97%
Mortgage Type
Credit Line Revolving
Estimated Equity
$1,757,812
Purchase Details
Closed on
Oct 23, 1996
Sold by
Mcniven Humphreys Charles F and Mcniven Scott
Bought by
Humphreys Charles Mcniven and Mcniven Scott
Purchase Details
Closed on
Nov 18, 1993
Sold by
Humphreys Charles F
Bought by
Mcniven Humphreys Charles Mcniven and Mcniven Humphreys Scott
Create a Home Valuation Report for This Property
The Home Valuation Report is an in-depth analysis detailing your home's value as well as a comparison with similar homes in the area
Home Values in the Area
Average Home Value in this Area
Purchase History
| Date | Buyer | Sale Price | Title Company |
|---|---|---|---|
| Humphreys Charles Mcniven | -- | None Available | |
| Humphreys Scott M | -- | North American Title Co | |
| Humphreys Charles Mcniven | -- | -- | |
| Mcniven Humphreys Charles Mcniven | -- | -- |
Source: Public Records
Mortgage History
| Date | Status | Borrower | Loan Amount |
|---|---|---|---|
| Open | Humphreys Scott M | $100,000 |
Source: Public Records
Tax History
| Year | Tax Paid | Tax Assessment Tax Assessment Total Assessment is a certain percentage of the fair market value that is determined by local assessors to be the total taxable value of land and additions on the property. | Land | Improvement |
|---|---|---|---|---|
| 2025 | $4,885 | $87,037 | $65,217 | $21,820 |
| 2024 | $4,885 | $85,331 | $63,938 | $21,393 |
| 2023 | $4,747 | $83,658 | $62,685 | $20,973 |
| 2022 | $4,577 | $82,018 | $61,456 | $20,562 |
| 2021 | $4,531 | $80,410 | $60,251 | $20,159 |
| 2020 | $4,081 | $79,585 | $59,633 | $19,952 |
| 2019 | $3,693 | $78,025 | $58,464 | $19,561 |
| 2018 | $3,582 | $76,495 | $57,318 | $19,177 |
| 2017 | $3,420 | $74,995 | $56,194 | $18,801 |
| 2016 | $3,156 | $73,525 | $55,092 | $18,433 |
| 2015 | $3,092 | $72,421 | $54,265 | $18,156 |
| 2014 | $3,102 | $71,002 | $53,202 | $17,800 |
Source: Public Records
Map
Nearby Homes
- 1610 Milvia St
- 1609 Bonita Ave Unit 5
- 1625 Martin Luther King jr Way
- 1682 Oxford St
- 2201 Virginia St Unit 2
- 1739 Spruce St
- 1515 Oxford St Unit 1D
- 1444 Walnut St
- 2340 Virginia St
- 1408 Henry St
- 1425 Martin Luther King jr Way
- 1622 Scenic Ave
- 1716 Hearst Ave
- 2421 Hilgard Ave
- 2112 Mckinley Ave Unit D
- 2451 Le Conte Ave
- 2477 Virginia St
- 2218 -2222 Grant St
- 2600 Hilgard Ave
- 2634 Virginia St Unit 33
- 2035 Francisco St
- 2027 Francisco St
- 2043 Francisco St
- 2025 Francisco St
- 2028 Francisco St Unit B
- 2028 Francisco St Unit 3
- 2028 Francisco St Unit 2
- 2028 Francisco St Unit A
- 2022 Virginia St Unit 3
- 2022 Virginia St Unit 2
- 2022 Virginia St Unit 7
- 2026 Francisco St Unit 16
- 2026 Francisco St
- 2020 Francisco St
- 2017 Francisco St
- 1700 Shattuck Ave
- 2018 Virginia St
- 1752 Shattuck Ave
- 2022 Francisco St
- 2014 Virginia St
Your Personal Tour Guide
Ask me questions while you tour the home.