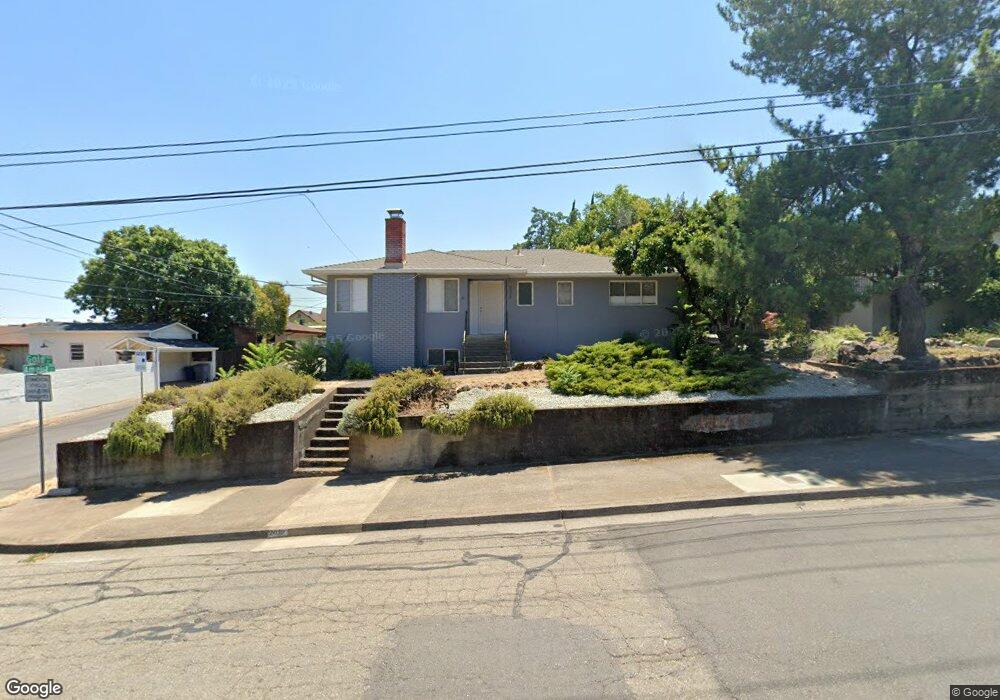
2039 Gold St Redding, CA 96001
Greenwood NeighborhoodEstimated Value: $346,782 - $358,000
3
Beds
3
Baths
1,544
Sq Ft
$228/Sq Ft
Est. Value
About This Home
This home is located at 2039 Gold St, Redding, CA 96001 and is currently estimated at $352,446, approximately $228 per square foot. 2039 Gold St is a home located in Shasta County with nearby schools including Cypress Elementary School, Sequoia Middle School, and Shasta High School.
Ownership History
Date
Name
Owned For
Owner Type
Purchase Details
Closed on
Sep 2, 2025
Sold by
Friel Aileen
Bought by
City Of Redding
Current Estimated Value
Purchase Details
Closed on
Sep 5, 2007
Sold by
Fitchett Monte C
Bought by
Fitchett Monte and Vance Sandra L
Create a Home Valuation Report for This Property
The Home Valuation Report is an in-depth analysis detailing your home's value as well as a comparison with similar homes in the area
Home Values in the Area
Average Home Value in this Area
Purchase History
| Date | Buyer | Sale Price | Title Company |
|---|---|---|---|
| City Of Redding | -- | None Listed On Document | |
| Fitchett Monte | -- | None Available | |
| Fitchett Monte | -- | None Available |
Source: Public Records
Tax History
| Year | Tax Paid | Tax Assessment Tax Assessment Total Assessment is a certain percentage of the fair market value that is determined by local assessors to be the total taxable value of land and additions on the property. | Land | Improvement |
|---|---|---|---|---|
| 2025 | $1,506 | $143,338 | $35,823 | $107,515 |
| 2024 | $1,483 | $140,528 | $35,121 | $105,407 |
| 2023 | $1,483 | $137,774 | $34,433 | $103,341 |
| 2022 | $1,458 | $135,073 | $33,758 | $101,315 |
| 2021 | $1,450 | $132,426 | $33,097 | $99,329 |
| 2020 | $1,469 | $131,069 | $32,758 | $98,311 |
| 2019 | $1,395 | $128,500 | $32,116 | $96,384 |
| 2018 | $1,407 | $125,982 | $31,487 | $94,495 |
| 2017 | $1,400 | $123,513 | $30,870 | $92,643 |
| 2016 | $1,355 | $121,092 | $30,265 | $90,827 |
| 2015 | $1,338 | $119,274 | $29,811 | $89,463 |
| 2014 | $1,329 | $116,939 | $29,228 | $87,711 |
Source: Public Records
Map
Nearby Homes
- 3024 West St
- 2381/2401 West St
- 2330 West St
- 1868 Gold St
- 2077 Skyline Dr
- 1777 Magnolia Ave
- 2036 Placer St
- 1545 Olive Ave
- 2315 Butte St
- 2327 Butte St
- 0 California St Unit 25-5331
- 1377 Willis St
- 2514 California St
- 1129 Magnolia Ave
- 1170 Orange Ave
- 1005 Gold St
- 2565 North St
- 1012 State St
- 2351 Eureka Way
- 815 Locust St
- 2049 Gold St
- 2000 Chestnut St
- 2015 Amelia Ct
- 2055 Gold St
- 2010 Chestnut St
- 2008 Amelia Ct
- 2016 Chestnut St
- 2016 Chestnut 1weup7o1l2hu
- 2042 Gold St
- 2028 Gold St
- 2020 Amelia Ct
- 2065 Gold St
- 1928 Chestnut St
- 2022 Chestnut St Unit 2
- 2022 Chestnut St
- 1918 Chestnut St
- 1907 Grace Ave
- 1926 Grace Ave
- 1903 Grace Ave
- 1901 Grace Ave
Your Personal Tour Guide
Ask me questions while you tour the home.