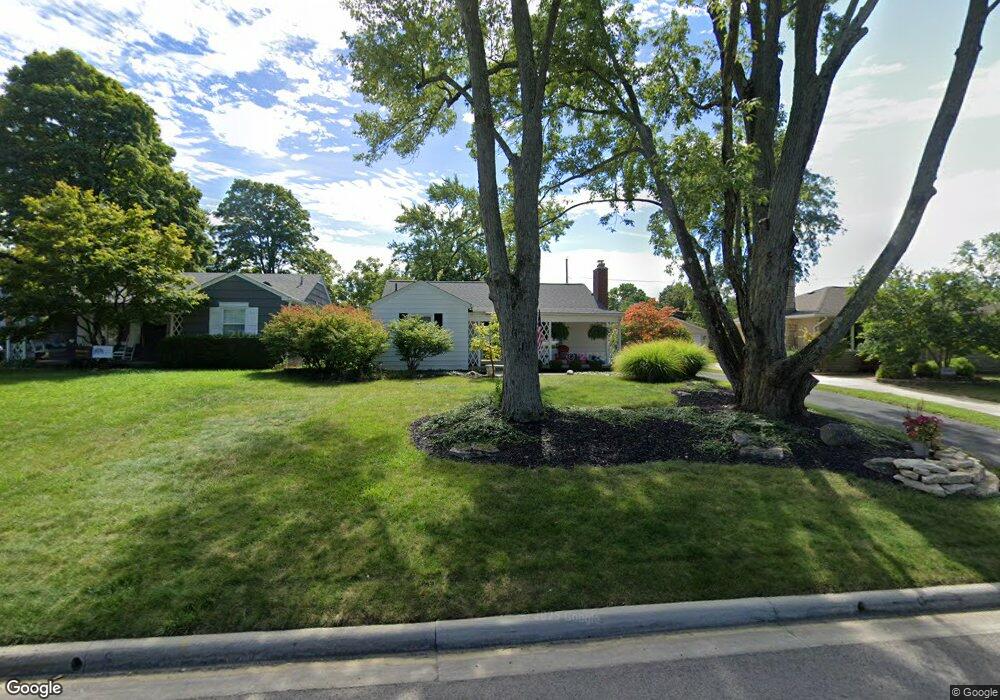
2039 Langham Rd Columbus, OH 43221
Estimated Value: $437,197 - $471,000
3
Beds
2
Baths
1,190
Sq Ft
$385/Sq Ft
Est. Value
About This Home
This home is located at 2039 Langham Rd, Columbus, OH 43221 and is currently estimated at $458,549, approximately $385 per square foot. 2039 Langham Rd is a home located in Franklin County with nearby schools including Tremont Elementary School, Jones Middle School, and Upper Arlington High School.
Ownership History
Date
Name
Owned For
Owner Type
Purchase Details
Closed on
Apr 22, 2022
Sold by
Battistone Joshua R and Battistone Kelly U
Bought by
Battistone Joshua R
Current Estimated Value
Home Financials for this Owner
Home Financials are based on the most recent Mortgage that was taken out on this home.
Original Mortgage
$312,000
Outstanding Balance
$290,765
Interest Rate
4.16%
Mortgage Type
Credit Line Revolving
Estimated Equity
$167,784
Purchase Details
Closed on
Dec 4, 2020
Sold by
Ubbing Kathryn M and Ubbng William J
Bought by
Battistone Joshua R and Battistone Kelly U
Home Financials for this Owner
Home Financials are based on the most recent Mortgage that was taken out on this home.
Original Mortgage
$315,000
Interest Rate
2.7%
Mortgage Type
New Conventional
Purchase Details
Closed on
Nov 15, 2002
Sold by
Fisher Mark S
Bought by
Ubbing Kathryn M
Purchase Details
Closed on
Mar 13, 1998
Sold by
Kelleher Fisher Mary Beth and Kelleher Mary B
Bought by
Fisher Mark S
Purchase Details
Closed on
Apr 22, 1992
Create a Home Valuation Report for This Property
The Home Valuation Report is an in-depth analysis detailing your home's value as well as a comparison with similar homes in the area
Home Values in the Area
Average Home Value in this Area
Purchase History
| Date | Buyer | Sale Price | Title Company |
|---|---|---|---|
| Battistone Joshua R | -- | Landsel Title Agency | |
| Battistone Joshua R | $350,000 | Valley Title & Escrow | |
| Ubbing Kathryn M | $195,000 | Title First Agency Inc | |
| Fisher Mark S | -- | -- | |
| -- | $94,600 | -- |
Source: Public Records
Mortgage History
| Date | Status | Borrower | Loan Amount |
|---|---|---|---|
| Open | Battistone Joshua R | $312,000 | |
| Previous Owner | Battistone Joshua R | $315,000 |
Source: Public Records
Tax History
| Year | Tax Paid | Tax Assessment Tax Assessment Total Assessment is a certain percentage of the fair market value that is determined by local assessors to be the total taxable value of land and additions on the property. | Land | Improvement |
|---|---|---|---|---|
| 2025 | $7,135 | $123,240 | $52,920 | $70,320 |
| 2024 | $7,135 | $123,240 | $52,920 | $70,320 |
| 2023 | $7,046 | $123,235 | $52,920 | $70,315 |
| 2022 | $6,861 | $98,180 | $34,020 | $64,160 |
| 2021 | $6,073 | $98,180 | $34,020 | $64,160 |
| 2020 | $6,157 | $98,180 | $34,020 | $64,160 |
| 2019 | $5,806 | $81,830 | $34,020 | $47,810 |
| 2018 | $5,308 | $81,830 | $34,020 | $47,810 |
| 2017 | $5,305 | $81,830 | $34,020 | $47,810 |
| 2016 | $4,846 | $71,370 | $24,680 | $46,690 |
| 2015 | $4,842 | $71,370 | $24,680 | $46,690 |
| 2014 | $4,847 | $71,370 | $24,680 | $46,690 |
| 2013 | $2,315 | $64,890 | $22,435 | $42,455 |
Source: Public Records
Map
Nearby Homes
- 3275 Colchester Rd
- 2089 Jervis Rd
- 3068 Tremont Rd
- 1842 Ridgecliff Rd
- 3175 Tremont Rd Unit 504
- 3134 Asbury Dr
- 1744 Ridgecliff Rd Unit 12
- 1763-1769 Ardleigh Rd Unit 1763-1769
- 2979 Avalon Rd
- 1815 Merriweather Dr
- 2182 Cranford Rd
- 2375 Swansea Rd
- 3030 Derby Rd
- 3418 Sunningdale Way
- 2695 Henthorn Rd
- 3670 Romnay Rd
- 2424 Nottingham Rd
- 2443 Shrewsbury Rd
- 3163 S Dorchester Rd
- 1490 Pemberton Dr
- 2031 Langham Rd
- 2023 Langham Rd
- 2055 Langham Rd
- 2046 Kentwell Rd
- 2038 Kentwell Rd
- 2054 Kentwell Rd
- 2063 Langham Rd
- 2015 Langham Rd
- 2030 Kentwell Rd
- 2062 Kentwell Rd
- 2038 Langham Rd
- 2030 Langham Rd
- 2046 Langham Rd
- 2022 Langham Rd
- 2054 Langham Rd
- 2022 Kentwell Rd
- 2070 Kentwell Rd
- 2007 Langham Rd
- 2071 Langham Rd
- 2062 Langham Rd
Your Personal Tour Guide
Ask me questions while you tour the home.