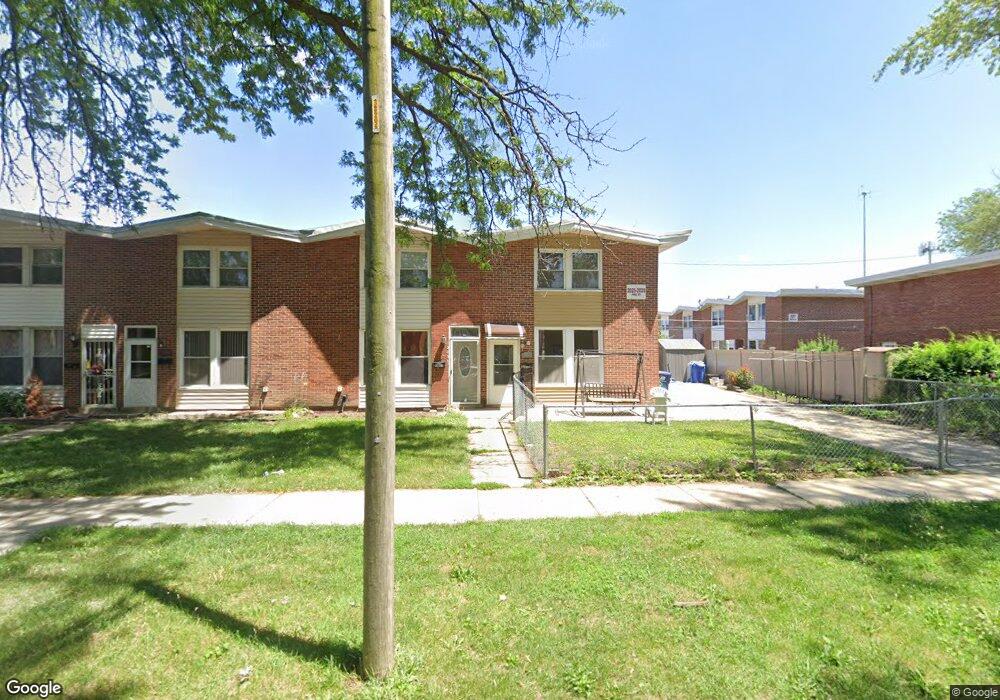
2039 Pine St Des Plaines, IL 60018
Estimated Value: $247,000 - $303,496
3
Beds
2
Baths
1,152
Sq Ft
$237/Sq Ft
Est. Value
About This Home
This home is located at 2039 Pine St, Des Plaines, IL 60018 and is currently estimated at $273,124, approximately $237 per square foot. 2039 Pine St is a home located in Cook County with nearby schools including Plainfield Elementary School, Algonquin Middle School, and Maine West High School.
Ownership History
Date
Name
Owned For
Owner Type
Purchase Details
Closed on
Feb 19, 2024
Sold by
Bhatnagar Jayant K and Bhatnagar Sadhwi
Bought by
Lytka Dmytro
Current Estimated Value
Home Financials for this Owner
Home Financials are based on the most recent Mortgage that was taken out on this home.
Original Mortgage
$256,500
Outstanding Balance
$250,716
Interest Rate
6.13%
Mortgage Type
New Conventional
Estimated Equity
$22,408
Purchase Details
Closed on
Jun 29, 2018
Sold by
Patel Natwar A and Patel Sarla N
Bought by
Bhatnagar Jayant K
Home Financials for this Owner
Home Financials are based on the most recent Mortgage that was taken out on this home.
Original Mortgage
$85,600
Interest Rate
4.75%
Mortgage Type
New Conventional
Purchase Details
Closed on
Sep 3, 2015
Sold by
Patel Natwar A and Patel Sarla N
Bought by
Patel Family Living Trust
Create a Home Valuation Report for This Property
The Home Valuation Report is an in-depth analysis detailing your home's value as well as a comparison with similar homes in the area
Home Values in the Area
Average Home Value in this Area
Purchase History
We collect this data history from publicly available records. To have your information removed, we recommend requesting removal directly through your county’s website.
| Date | Buyer | Sale Price | Title Company |
|---|---|---|---|
| Lytka Dmytro | $285,000 | First American Title | |
| Lytka Dmytro | $285,000 | First American Title | |
| Bhatnagar Jayant K | $107,000 | Attorney | |
| Patel Family Living Trust | -- | Attorney |
Source: Public Records
Mortgage History
We collect this data history from publicly available records. To have your information removed, we recommend requesting removal directly through your county’s website.
| Date | Status | Borrower | Loan Amount |
|---|---|---|---|
| Open | Lytka Dmytro | $256,500 | |
| Closed | Lytka Dmytro | $256,500 | |
| Previous Owner | Bhatnagar Jayant K | $85,600 |
Source: Public Records
Tax History
| Year | Tax Paid | Tax Assessment Tax Assessment Total Assessment is a certain percentage of the fair market value that is determined by local assessors to be the total taxable value of land and additions on the property. | Land | Improvement |
|---|---|---|---|---|
| 2025 | $5,009 | $19,000 | $4,118 | $14,882 |
| 2024 | $5,009 | $19,000 | $3,000 | $16,000 |
| 2023 | $4,889 | $19,000 | $3,000 | $16,000 |
| 2022 | $4,889 | $19,000 | $3,000 | $16,000 |
| 2021 | $3,930 | $12,784 | $1,750 | $11,034 |
| 2020 | $3,863 | $12,784 | $1,750 | $11,034 |
| 2019 | $3,866 | $14,365 | $1,750 | $12,615 |
| 2018 | $3,563 | $11,912 | $1,544 | $10,368 |
| 2017 | $3,500 | $11,912 | $1,544 | $10,368 |
| 2016 | $3,310 | $11,912 | $1,544 | $10,368 |
| 2015 | $3,594 | $11,890 | $1,338 | $10,552 |
| 2014 | $3,519 | $11,890 | $1,338 | $10,552 |
| 2013 | $3,431 | $11,890 | $1,338 | $10,552 |
Source: Public Records
Map
Nearby Homes
- 2129 Ash St Unit G
- 1370 Fargo Ave Unit E
- 1857 Pine St
- 1678 Ash St
- 1830 Dexter Ln
- 1629 E Touhy Ave
- 1693 Linden St
- 1641 E Touhy Ave
- 1509 Center St
- 805 S Tures Ln
- 2124 Westview Dr
- 1541 Cooper St
- 1738 Lunt Ave
- 1078 Bogart St
- 1080 Bogart St
- 1030 Bogart St
- 2323 Douglas Ave
- 1640 S River Rd
- 616 Birchwood Ave
- 614 Birchwood Ave
Your Personal Tour Guide
Ask me questions while you tour the home.