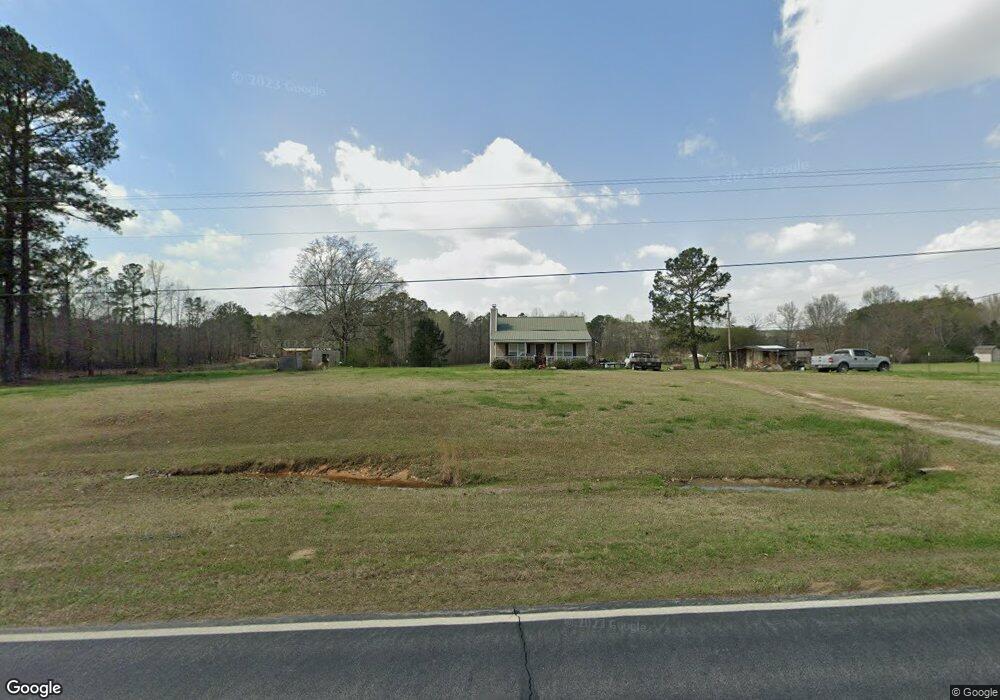
2039 Thompson Rd Franklin, GA 30217
Estimated Value: $212,320 - $631,000
3
Beds
2
Baths
1,020
Sq Ft
$337/Sq Ft
Est. Value
About This Home
This home is located at 2039 Thompson Rd, Franklin, GA 30217 and is currently estimated at $344,080, approximately $337 per square foot. 2039 Thompson Rd is a home located in Heard County with nearby schools including Heard County High School.
Ownership History
Date
Name
Owned For
Owner Type
Purchase Details
Closed on
Jun 13, 2003
Sold by
Harmon Samuel A
Bought by
Beckom Billy Joe
Current Estimated Value
Purchase Details
Closed on
Apr 29, 2003
Sold by
Secretary Of Housing & Urban D
Bought by
Harmon Samuel A
Purchase Details
Closed on
Sep 12, 2002
Sold by
Community Mortgage Services Inc
Bought by
Secretary Of Housing & Urban Development
Purchase Details
Closed on
Oct 20, 2000
Sold by
Driver Wayne
Bought by
Manning Timothy R
Purchase Details
Closed on
Sep 25, 2000
Sold by
Driver Wayne and Driver Nancy
Bought by
Driver Wayne
Purchase Details
Closed on
Mar 6, 1996
Sold by
Brown Jack P & Co In
Bought by
Driver Wayne and Driver Nancy
Purchase Details
Closed on
Dec 18, 1995
Sold by
Stacy John L and Stacy Lisa
Bought by
Brown Jack P & Co In
Purchase Details
Closed on
Jun 1, 1992
Sold by
Brown Jack P & Co
Bought by
Stacy John L and Stacy Lisa
Create a Home Valuation Report for This Property
The Home Valuation Report is an in-depth analysis detailing your home's value as well as a comparison with similar homes in the area
Home Values in the Area
Average Home Value in this Area
Purchase History
| Date | Buyer | Sale Price | Title Company |
|---|---|---|---|
| Beckom Billy Joe | $85,000 | -- | |
| Harmon Samuel A | -- | -- | |
| Secretary Of Housing & Urban Development | $104,800 | -- | |
| Community Mortgage Services Inc | $104,800 | -- | |
| Manning Timothy R | $15,000 | -- | |
| Driver Wayne | -- | -- | |
| Driver Wayne | -- | -- | |
| Brown Jack P & Co In | -- | -- | |
| Stacy John L | $8,000 | -- |
Source: Public Records
Tax History Compared to Growth
Tax History
| Year | Tax Paid | Tax Assessment Tax Assessment Total Assessment is a certain percentage of the fair market value that is determined by local assessors to be the total taxable value of land and additions on the property. | Land | Improvement |
|---|---|---|---|---|
| 2024 | $1,045 | $53,829 | $8,536 | $45,293 |
| 2023 | $943 | $47,197 | $7,114 | $40,083 |
| 2022 | $891 | $44,703 | $4,831 | $39,872 |
| 2021 | $732 | $35,303 | $4,831 | $30,472 |
| 2020 | $694 | $33,250 | $4,831 | $28,419 |
| 2019 | $694 | $33,250 | $4,831 | $28,419 |
| 2018 | $753 | $33,250 | $4,831 | $28,419 |
| 2017 | $660 | $31,239 | $4,245 | $26,994 |
| 2016 | $660 | $31,239 | $4,245 | $26,994 |
| 2015 | -- | $29,977 | $7,254 | $22,724 |
| 2014 | -- | $29,978 | $7,254 | $22,724 |
| 2013 | -- | $33,744 | $7,254 | $26,490 |
Source: Public Records
Map
Nearby Homes
- 915 Pea Ridge Rd
- Tr 5 Unit 19.018 ac Pike Roa
- 815 Birch Rd
- Tr 4 Unit 15.976 ac Pike Roa
- 1221 US Highway 27
- 0 Tuscan Hills Rd Unit 10641286
- 00 Tuscan Hills Rd
- 000 Us Highway 27
- 17426 Georgia 34
- TR 4 15.976 AC Pike Rd
- TR 5 19.018 AC Pike Rd
- 0 Dr Fisher Rd Unit 10583815
- 38 Daniel Cir
- 441 Newnan St
- 284 Newnan St
- 325 Newnan St
- 211 Main St
- 319 +/- AC Georgia 100
- 140+/- AC Georgia 100
- 0 Georgia 100 Unit 10604110